OPEN-SOURCE SCRIPT
Linear Regression Indicator
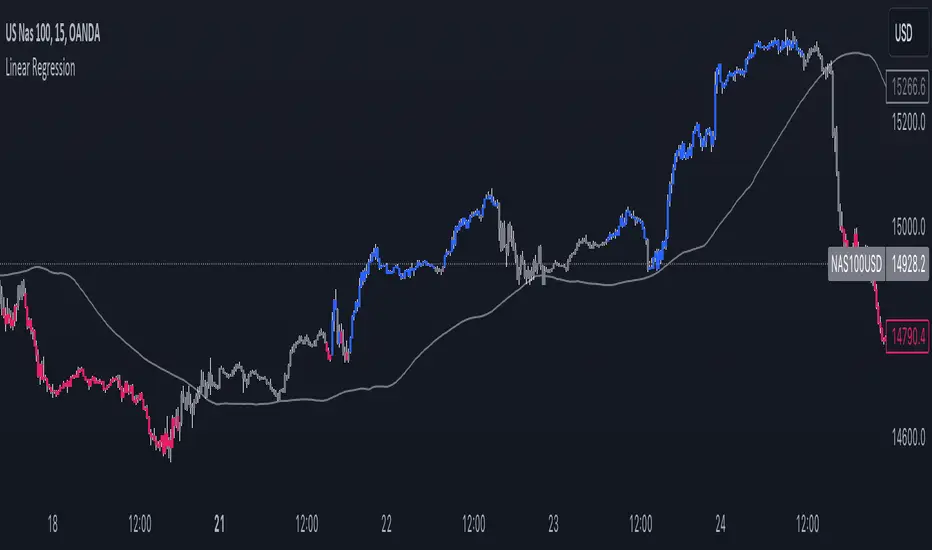
This tool can be used to determine the direction of the current trend.
The indicator changes the color of the candles based on the direction of the linear regression formula. This is made settings the length of the short-term linear regression in the settings, the longer one is also based on that parameter but significantly larger.
The indicator also plots the average between the two linear regression lines used in the candle coloring formula, and can be used both for support and resistance or as a trend line used to analyze breakouts.
開源腳本
秉持TradingView一貫精神,這個腳本的創作者將其設為開源,以便交易者檢視並驗證其功能。向作者致敬!您可以免費使用此腳本,但請注意,重新發佈代碼需遵守我們的社群規範。
免責聲明
這些資訊和出版物並非旨在提供,也不構成TradingView提供或認可的任何形式的財務、投資、交易或其他類型的建議或推薦。請閱讀使用條款以了解更多資訊。
開源腳本
秉持TradingView一貫精神,這個腳本的創作者將其設為開源,以便交易者檢視並驗證其功能。向作者致敬!您可以免費使用此腳本,但請注意,重新發佈代碼需遵守我們的社群規範。
免責聲明
這些資訊和出版物並非旨在提供,也不構成TradingView提供或認可的任何形式的財務、投資、交易或其他類型的建議或推薦。請閱讀使用條款以了解更多資訊。