OPEN-SOURCE SCRIPT
MFI Candles MTF Table

MFI Candles + Multi-Timeframe Table | by julzALGO
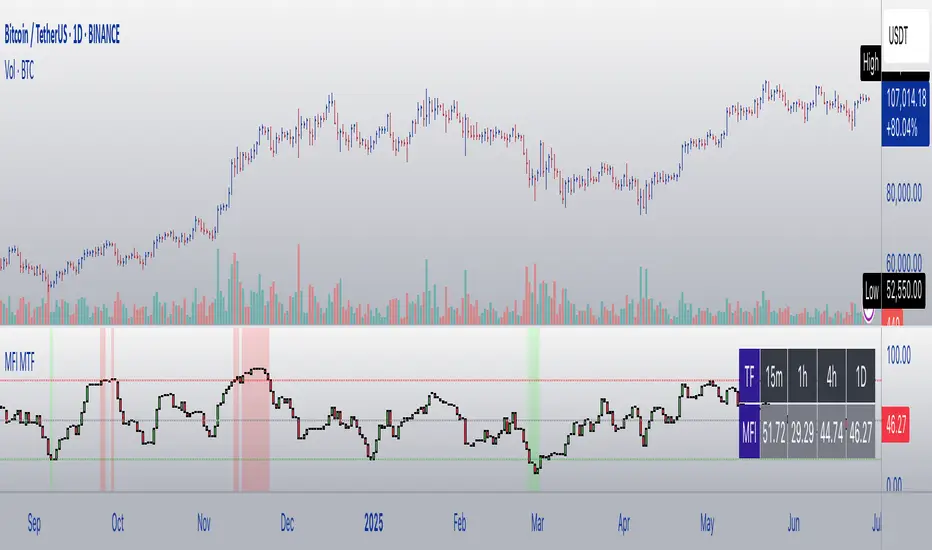
This open-source script visualizes the Money Flow Index (MFI) in a new format — as candles instead of a traditional oscillator line. It provides a clean, volume-driven view of momentum and pressure, ideal for traders seeking more actionable and visual cues than a typical MFI plot.
What Makes It Unique:
• Plots "MFI Candles" — synthetic candles based on smoothed MFI values using a selected timeframe (default: 1D), giving a new way to read volume flow.
• Candles reflect momentum: green if MFI rises, red if it falls.
• Background turns red when MFI is overbought (≥ 80) or green when oversold (≤ 20).
Multi-Timeframe Strength Table:
• Displays MFI values from 15m, 1h, 4h, and 1D timeframes — all in one dashboard.
• Color-coded for quick recognition: 🔴 Overbought, 🟢 Oversold.
• Values are smoothed with linear regression for better clarity.
Custom Settings:
• MFI calculation length
• Smoothing factor
• Candle source timeframe
• Toggle table and OB/OS background
How to Use:
- Use MFI Candles to monitor momentum shifts based on money flow.
- Use the Multi-Timeframe Table to identify when multiple timeframes align — helpful for timing entries and exits.
- Watch the background for extreme conditions (OB/OS) that may signal upcoming reversals or pressure exhaustion.
Happy Trading!
開源腳本
秉持TradingView一貫精神,這個腳本的創作者將其設為開源,以便交易者檢視並驗證其功能。向作者致敬!您可以免費使用此腳本,但請注意,重新發佈代碼需遵守我們的社群規範。
免責聲明
這些資訊和出版物並非旨在提供,也不構成TradingView提供或認可的任何形式的財務、投資、交易或其他類型的建議或推薦。請閱讀使用條款以了解更多資訊。
開源腳本
秉持TradingView一貫精神,這個腳本的創作者將其設為開源,以便交易者檢視並驗證其功能。向作者致敬!您可以免費使用此腳本,但請注意,重新發佈代碼需遵守我們的社群規範。
免責聲明
這些資訊和出版物並非旨在提供,也不構成TradingView提供或認可的任何形式的財務、投資、交易或其他類型的建議或推薦。請閱讀使用條款以了解更多資訊。