OPEN-SOURCE SCRIPT
已更新 Relative Volume Intensity Control Chart
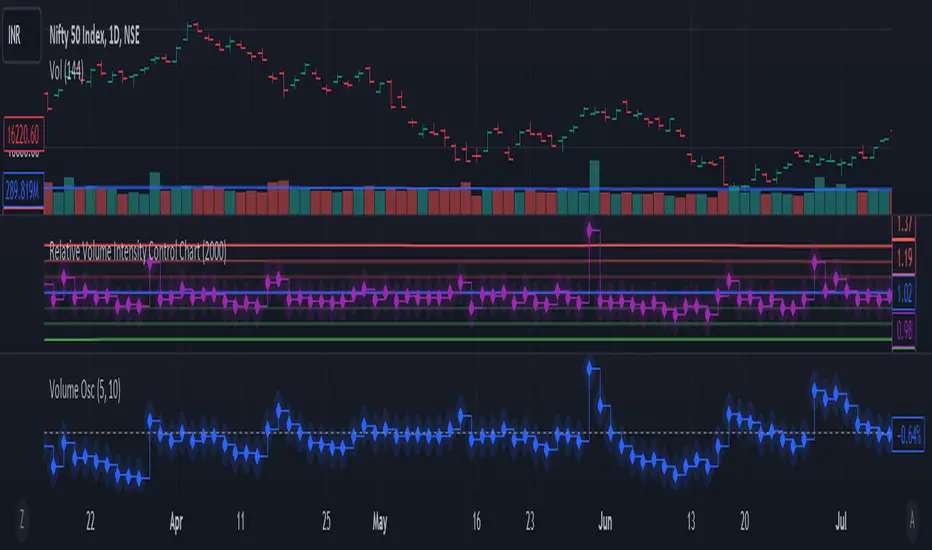
***NOTE THE VOLUME OSCILATOR PROVIDED AT THE BOTTOM IS FOR COMPARSION AND IS NOT PART OF THE INDICATOR****
This indicator provides a comprehensive and a nuanced representation of volume relative to historical volume. The indicator aims to provide insights into the relative intensity of trading volume compared to historical data. It calculates two types of relative volume intensity: mean volume intensity and point volume intensity. The final indicator, "Relative_volume_intensity," is a combination of these two.
1. Point Volume Intensity:
Calculate the ratio of the current volume to the corresponding SMA from the previous period for each of the periods.
Normalize each ratio by dividing it by the corresponding normalized SMA.
Assign weights to each normalized ratio and calculate the point volume intensity.
Point volume intensity calculates the intensity of the current trading volume at a specific point in time relative to its historical moving average. It assesses how much the current volume deviates from the previous historical average for different lookback periods(current volume/ average volume of previous n days). The calculation involves dividing the current volume by the corresponding previous historical moving average and normalizing the result. The purpose of point volume intensity is to capture the immediate impact of the current volume on the overall intensity, providing a more dynamic and responsive measure.
2. Mean Volume Intensity:
Calculate the simple moving averages (SMA) of the volume for different periods (5, 8, 13, 21, 34, 55, 89, 144).
Normalize each SMA by dividing it by the SMA with the longest lookback (144).
Assign weights to each normalized SMA and calculate the mean volume intensity.
Mean volume intensity, on the other hand, takes a broader approach by looking at the mean (average) of various historical moving averages of volume. Instead of focusing on the current volume alone, it considers the historical average intensity over multiple periods. The purpose of mean volume intensity is to provide a smoother and more stable representation of the overall historical volume intensity. It helps filter out short-term fluctuations and provides a more comprehensive view of how the current volume compares to historical norms.
Purpose of Both:
Both point volume intensity and mean volume intensity contribute to the calculation of the final indicator, "Relative_volume_intensity." The idea is to combine these two perspectives to create a more comprehensive measure of relative volume intensity. By assigning equal weights to both components and taking a balanced approach, the indicator aims to capture both short-term spikes in volume and trends in volume intensity over a relatively extended periods.
In calculation of both point volume intensity and mean volume intensity, shorter-term moving averages (e.g., 5, 8) have higher weights, suggesting a greater emphasis on recent volume behavior.
Visualization:
The script then calculates the mean and standard deviation of the relative volume intensity over a specified lookback length.
Plot lines for the centerline (mean), upper and lower 3 standard deviations, upper and lower 2 standard deviations, and upper and lower 1 standard deviation.
Plot the relative volume intensity as a step line with diamond markers.
It is displayed like a control chart where we can see how the relative intensity is behaving when compared to longer historical lookback period.
發行說明
Introduced another factor, Time Normalized Intensity: Version 2 includes a new component called Time_Normalized_Volume_Intenstiy, calculated using a function that Trading view has release calculates relative volume ratios by comparing current volume at a particular time with average volume over previous n days at the same time, for example at 9:15 AM. This is a significant addition compared to Version 1. This accounts for volume spikes which are just time dependent like the spike in volume at the opening of a day. The default is ~0.33% weight is given to Point Volume Intensity, Mean volume Intensity and Time Normalized Volume Intensity. This captures a more compressive snapshot of volume compared to its historical value. 開源腳本
本著TradingView的真正精神,此腳本的創建者將其開源,以便交易者可以查看和驗證其功能。向作者致敬!雖然您可以免費使用它,但請記住,重新發佈程式碼必須遵守我們的網站規則。
免責聲明
這些資訊和出版物並不意味著也不構成TradingView提供或認可的金融、投資、交易或其他類型的意見或建議。請在使用條款閱讀更多資訊。
開源腳本
本著TradingView的真正精神,此腳本的創建者將其開源,以便交易者可以查看和驗證其功能。向作者致敬!雖然您可以免費使用它,但請記住,重新發佈程式碼必須遵守我們的網站規則。
免責聲明
這些資訊和出版物並不意味著也不構成TradingView提供或認可的金融、投資、交易或其他類型的意見或建議。請在使用條款閱讀更多資訊。