INVITE-ONLY SCRIPT
已更新 Options Flow Intraday Sentiment
Script useful for Intraday Trading - which based on Options data loaded in background - is showing sentiment of Investors. Very often Options are forecasting and precedes moves that will happen later on derivatives like Futures Contracts. Due to its' nature, data is useful during Regular Trading Hours sessions ( RTH ).
We take into account Options Volume flow & Put/Call Ratio from Options. Data is based from dataset on Quandl and loaded to TradingView. Therefore data is normalized as per different factors we have different scale of received data. Then I apply calculations comparing PUT and CALL Volume, giving the biggest weight ratio to those Options which have nearest Expiration Date. Another condition taken into account is Type of Option: either In the Money, Out of Money or At the money. Last but not least for Options there is calculated risk, where those orderflow entries with lowest risk are having the biggest weight in calculation while those with highest risk - are having lower ratio. Risk is calculated based on delta factor (coming out of Options standard definitions).
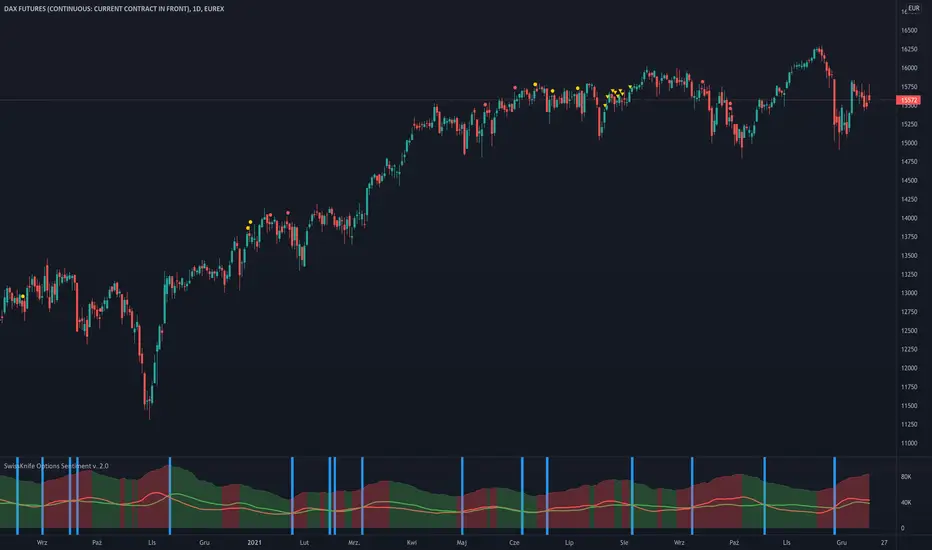
Background of indicator is coloured in direction of sentiment when we have alignment of sentiment factors calculated in background in one direction. Script is displaying additionally PUT Volume, CALL Volume from Options and PUT/CALL Ratio. Those are only additional information that can be useful for traders, but the whole logic is hidden under the hood (as described earlier) and is showing coloured background when sentiment is aligned. Therefore be prepared to take potentially a trade in direction of the background - but not blindly
Currently it's supporting SPX ( S&P500 ) and support for more instruments will come with next updates.
We take into account Options Volume flow & Put/Call Ratio from Options. Data is based from dataset on Quandl and loaded to TradingView. Therefore data is normalized as per different factors we have different scale of received data. Then I apply calculations comparing PUT and CALL Volume, giving the biggest weight ratio to those Options which have nearest Expiration Date. Another condition taken into account is Type of Option: either In the Money, Out of Money or At the money. Last but not least for Options there is calculated risk, where those orderflow entries with lowest risk are having the biggest weight in calculation while those with highest risk - are having lower ratio. Risk is calculated based on delta factor (coming out of Options standard definitions).
Background of indicator is coloured in direction of sentiment when we have alignment of sentiment factors calculated in background in one direction. Script is displaying additionally PUT Volume, CALL Volume from Options and PUT/CALL Ratio. Those are only additional information that can be useful for traders, but the whole logic is hidden under the hood (as described earlier) and is showing coloured background when sentiment is aligned. Therefore be prepared to take potentially a trade in direction of the background - but not blindly
Currently it's supporting SPX ( S&P500 ) and support for more instruments will come with next updates.
發行說明
- added display and calculation of Balance Points - where Supply and Demand are balanced/equal based on the data from PUTs and CALLs read from Quandl dataset
- changed display of leading side on the market - green area represents dominating Bulls while Red - Bears
- script is now universally selecting in the background source of Options data based on instrument & chart on which it's placed; in case of unsupported instrument no data will appear
- script works best on D1 timeframe (due to changed logic of calculation Options data and its' ratios)
發行說明
- added new display mode to display difference histogram between Supply and Demand instead of default view of Moving Average Lines
- Orange histogram shows dominance of Supply (Bearish Market) and Blue one represents dominance of Demand (Bullish Market)
發行說明
- added alerts when Volume Flow switch from/to Bullish/Bearish
- modified visualisation of net difference between Volume of PUT and CALL Options
僅限邀請腳本
只有經作者授權的使用者才能訪問此腳本,且通常需付費。您可以將此腳本加入收藏,但需先向作者申請並獲得許可後才能使用 — 點擊此處了解更多。如需更多詳情,請依照作者說明或直接聯繫skyline-trader。
除非您完全信任其作者並了解腳本的工作原理,否則TradingView不建議您付費或使用腳本。您也可以在我們的社群腳本中找到免費的開源替代方案。
作者的說明
提醒:在請求訪問權限之前,請閱讀僅限邀請腳本指南。
免責聲明
這些資訊和出版物並不意味著也不構成TradingView提供或認可的金融、投資、交易或其他類型的意見或建議。請在使用條款閱讀更多資訊。
僅限邀請腳本
只有經作者授權的使用者才能訪問此腳本,且通常需付費。您可以將此腳本加入收藏,但需先向作者申請並獲得許可後才能使用 — 點擊此處了解更多。如需更多詳情,請依照作者說明或直接聯繫skyline-trader。
除非您完全信任其作者並了解腳本的工作原理,否則TradingView不建議您付費或使用腳本。您也可以在我們的社群腳本中找到免費的開源替代方案。
作者的說明
提醒:在請求訪問權限之前,請閱讀僅限邀請腳本指南。
免責聲明
這些資訊和出版物並不意味著也不構成TradingView提供或認可的金融、投資、交易或其他類型的意見或建議。請在使用條款閱讀更多資訊。