OPEN-SOURCE SCRIPT
已更新 Wick Delta Buy/Sell Pressure
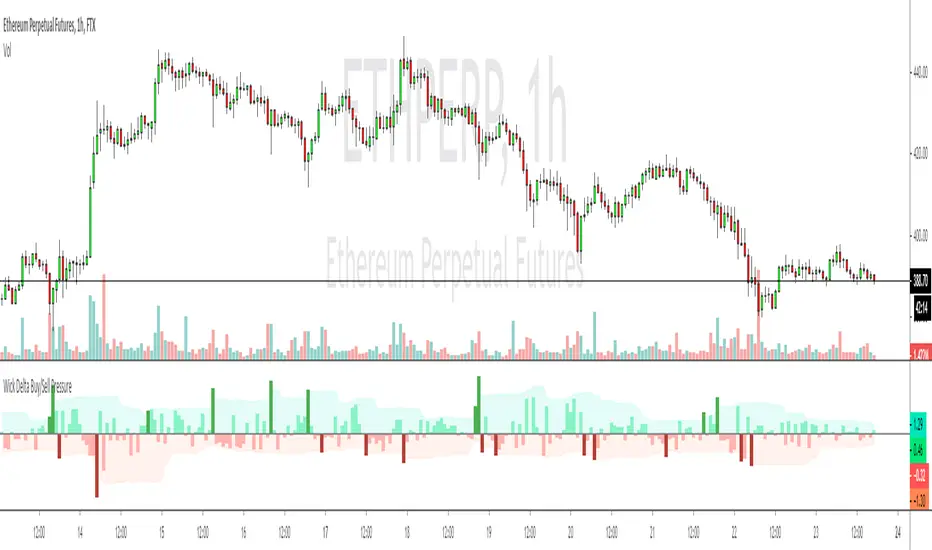
If you think of a perfect doji candle, where the wicks on top and bottom are exactly the same, that's a candle with a delta of 0. What this indicator does is show the delta/difference between wicks, if the top wick is longer than the bottom wick it show's sell pressure/bear interest, which is displayed as a red bar and vice versa for buy/bull pressure, which is shown as green bars. I added arrows for clarity.
It's a different way of visualising wicks, which can clarify sentiment and be a useful way to understand wicks better in general. One way to use it is to look for clusters of 3/4 larger bars in a row, which generally helps to determine future direction especially when seen at important levels.
It's a different way of visualising wicks, which can clarify sentiment and be a useful way to understand wicks better in general. One way to use it is to look for clusters of 3/4 larger bars in a row, which generally helps to determine future direction especially when seen at important levels.
發行說明
Updated to highlight the bigger/more important wicks開源腳本
本著TradingView的真正精神,此腳本的創建者將其開源,以便交易者可以查看和驗證其功能。向作者致敬!雖然您可以免費使用它,但請記住,重新發佈程式碼必須遵守我們的網站規則。
免責聲明
這些資訊和出版物並不意味著也不構成TradingView提供或認可的金融、投資、交易或其他類型的意見或建議。請在使用條款閱讀更多資訊。
開源腳本
本著TradingView的真正精神,此腳本的創建者將其開源,以便交易者可以查看和驗證其功能。向作者致敬!雖然您可以免費使用它,但請記住,重新發佈程式碼必須遵守我們的網站規則。
免責聲明
這些資訊和出版物並不意味著也不構成TradingView提供或認可的金融、投資、交易或其他類型的意見或建議。請在使用條款閱讀更多資訊。