PhenLabs - Market Fluid Dynamics📊 Market Fluid Dynamics -
Version: PineScript™ v6
📌 Description
The Market Fluid Dynamics - Phen indicator is a new thinking regarding market analysis by modeling price action, volume, and volatility using a fluid system. It attempts to offer traders control over more profound market forces, such as momentum (speed), resistance (thickness), and buying/selling pressure. By visualizing such dynamics, the script allows the traders to decide on the prevailing market flow, its power, likely continuations, and zones of calmness and chaos, and thereby allows improved decision-making.
This measure avoids the usual difficulty of reconciling multiple, often contradictory, market indications by including them within a single overarching model. It moves beyond traditional binary indicators by providing a multi-dimensional view of market behavior, employing fluid dynamic analogs to describe complex interactions in an accessible manner.
🚀 Points of Innovation
Integrated Fluid Dynamics Model: Combines velocity, viscosity, pressure, and turbulence into a single indicator.
Normalized Metrics: Uses ATR and other normalization techniques for consistent readings across different assets and timeframes.
Dynamic Flow Visualization: Main flow line changes color and intensity based on direction and strength.
Turbulence Background: Visually represents market stability with a gradient background, from calm to turbulent.
Comprehensive Dashboard: Provides an at-a-glance summary of key fluid dynamic metrics.
Multi-Layer Smoothing: Employs several layers of EMA smoothing for a clearer, more responsive main flow line.
🔧 Core Components
Velocity Component: Measures price momentum (first derivative of price), normalized by ATR. It indicates the speed and direction of price changes.
Viscosity Component: Represents market resistance to price changes, derived from ATR relative to its historical average. Higher viscosity suggests it’s harder for prices to move.
Pressure Component: Quantifies the force created by volume and price range (close - open), normalized by ATR. It reflects buying or selling pressure.
Turbulence Detection: Calculates a Reynolds number equivalent to identify market stability, ranging from laminar (stable) to turbulent (chaotic).
Main Flow Indicator: Combines the above components, applying sensitivity and smoothing, to generate a primary signal of market direction and strength.
🔥 Key Features
Advanced Smoothing Algorithm: Utilizes multiple EMA layers on the raw flow calculation for a fluid and responsive main flow line, reducing noise while maintaining sensitivity.
Gradient Flow Coloring: The main flow line dynamically changes color from light to deep blue for bullish flow and light to deep red for bearish flow, with intensity reflecting flow strength. This provides an immediate visual cue of market sentiment and momentum.
Turbulence Level Background: The chart background changes color based on calculated turbulence (from calm gray to vibrant orange), offering an intuitive understanding of market stability and potential for erratic price action.
Informative Dashboard: A customizable on-screen table displays critical metrics like Flow State, Flow Strength, Market Viscosity, Turbulence, Pressure Force, Flow Acceleration, and Flow Continuity, allowing traders to quickly assess current market conditions.
Configurable Lookback and Sensitivity: Users can adjust the base lookback period for calculations and the sensitivity of the flow to viscosity, tailoring the indicator to different trading styles and market conditions.
Alert Conditions: Pre-defined alerts for flow direction changes (positive/negative crossover of zero line) and detection of high turbulence states.
🎨 Visualization
Main Flow Line: A smoothed line plotted below the main chart, colored blue for bullish flow and red for bearish flow. The intensity of the color (light to dark) indicates the strength of the flow. This line crossing the zero line can signal a change in market direction.
Zero Line: A dotted horizontal line at the zero level, serving as a baseline to gauge whether the market flow is positive (bullish) or negative (bearish).
Turbulence Background: The indicator pane’s background color changes based on the calculated turbulence level. A calm, almost transparent gray indicates low turbulence (laminar flow), while a more vibrant, semi-transparent orange signifies high turbulence. This helps traders visually assess market stability.
Dashboard Table: An optional table displayed on the chart, showing key metrics like ‘Flow State’, ‘Flow Strength’, ‘Market Viscosity’, ‘Turbulence’, ‘Pressure Force’, ‘Flow Acceleration’, and ‘Flow Continuity’ with their current values and qualitative descriptions (e.g., ‘Bullish Flow’, ‘Laminar (Stable)’).
📖 Usage Guidelines
Setting Categories
Show Dashboard - Default: true; Range: true/false; Description: Toggles the visibility of the Market Fluid Dynamics dashboard on the chart. Enable to see key metrics at a glance.
Base Lookback Period - Default: 14; Range: 5 - (no upper limit, practical limits apply); Description: Sets the primary lookback period for core calculations like velocity, ATR, and volume SMA. Shorter periods make the indicator more sensitive to recent price action, while longer periods provide a smoother, slower signal.
Flow Sensitivity - Default: 0.5; Range: 0.1 - 1.0 (step 0.1); Description: Adjusts how much the market viscosity dampens the raw flow. A lower value means viscosity has less impact (flow is more sensitive to raw velocity/pressure), while a higher value means viscosity has a greater dampening effect.
Flow Smoothing - Default: 5; Range: 1 - 20; Description: Controls the length of the EMA smoothing applied to the main flow line. Higher values result in a smoother flow line but with more lag; lower values make it more responsive but potentially noisier.
Dashboard Position - Default: ‘Top Right’; Range: ‘Top Right’, ‘Top Left’, ‘Bottom Right’, ‘Bottom Left’, ‘Middle Right’, ‘Middle Left’; Description: Determines the placement of the dashboard on the chart.
Header Size - Default: ‘Normal’; Range: ‘Tiny’, ‘Small’, ‘Normal’, ‘Large’, ‘Huge’; Description: Sets the text size for the dashboard header.
Values Size - Default: ‘Small’; Range: ‘Tiny’, ‘Small’, ‘Normal’, ‘Large’; Description: Sets the text size for the metric values in the dashboard.
✅ Best Use Cases
Trend Identification: Identifying the dominant market flow (bullish or bearish) and its strength to trade in the direction of the prevailing trend.
Momentum Confirmation: Using the flow strength and acceleration to confirm the conviction behind price movements.
Volatility Assessment: Utilizing the turbulence metric to gauge market stability, helping to adjust position sizing or avoid choppy conditions.
Reversal Spotting: Watching for divergences between price and flow, or crossovers of the main flow line above/below the zero line, as potential reversal signals, especially when combined with changes in pressure or viscosity.
Swing Trading: Leveraging the smoothed flow line to capture medium-term market swings, entering when flow aligns with the desired trade direction and exiting when flow weakens or reverses.
Intraday Scalping: Using shorter lookback periods and higher sensitivity to identify quick shifts in flow and turbulence for short-term trading opportunities, particularly in liquid markets.
⚠️ Limitations
Lagging Nature: Like many indicators based on moving averages and lookback periods, the main flow line can lag behind rapid price changes, potentially leading to delayed signals.
Whipsaws in Ranging Markets: During periods of low volatility or sideways price action (high viscosity, low flow strength), the indicator might produce frequent buy/sell signals (whipsaws) as the flow oscillates around the zero line.
Not a Standalone System: While comprehensive, it should be used in conjunction with other forms of analysis (e.g., price action, support/resistance levels, other indicators) and not as a sole basis for trading decisions.
Subjectivity in Interpretation: While the dashboard provides quantitative values, the interpretation of “strong” flow, “high” turbulence, or “significant” acceleration can still have a subjective element depending on the trader’s strategy and risk tolerance.
💡 What Makes This Unique
Fluid Dynamics Analogy: Its core strength lies in translating complex market interactions into an intuitive fluid dynamics framework, making concepts like momentum, resistance, and pressure easier to visualize and understand.
Market View: Instead of focusing on a single aspect (like just momentum or just volatility), it integrates multiple factors (velocity, viscosity, pressure, turbulence) to provide a more comprehensive picture of market conditions.
Adaptive Visualization: The dynamic coloring of the flow line and the turbulence background provide immediate, adaptive visual feedback that changes with market conditions.
🔬 How It Works
Price Velocity Calculation: The indicator first calculates price velocity by measuring the rate of change of the closing price over a given ‘lookback’ period. The raw velocity is then normalized by the Average True Range (ATR) of the same lookback period. Normalization enables comparison of momentum between assets or timeframes by scaling for volatility. This is the direction and speed of initial price movement.
Viscosity Calculation: Market ‘viscosity’ or resistance to price movement is determined by looking at the current ATR relative to its longer-term average (SMA of ATR over lookback * 2). The further the current ATR is above its average, the lower the viscosity (less resistance to price movement), and vice-versa. The script inverts this relationship and bounds it so that rising viscosity means more resistance.
Pressure Force Measurement: A ‘pressure’ variable is calculated as a function of the ratio of current volume to its simple moving average, multiplied by the price range (close - open) and normalized by ATR. This is designed to measure the force behind price movement created by volume and intraday price thrusts. This pressure is smoothed by an EMA.
Turbulence State Evaluation: A equivalent ‘Reynolds number’ is calculated by dividing the absolute normalized velocity by the viscosity. This is the proclivity of the market to move in a chaotic or orderly fashion. This ‘reynoldsValue’ is smoothed with an EMA to get the ‘turbulenceState’, which indicates if the market is laminar (stable), transitional, or turbulent.
Main Flow Derivation: The ‘rawFlow’ is calculated by taking the normalized velocity, dampening its impact based on the ‘viscosity’ and user-input ‘sensitivity’, and orienting it by the sign of the smoothed ‘pressureSmooth’. The ‘rawFlow’ is then put through multiple layers of exponential moving average (EMA) smoothing (with ‘smoothingLength’ and derived values) to reach the final ‘mainFlow’ line. The extensive smoothing is designed to give a smooth and clear visualization of the overall market direction and magnitude.
Dashboard Metrics Compilation: Additional metrics like flow acceleration (derivative of mainFlow), and flow continuity (correlation between close and volume) are calculated. All primary components (Flow State, Strength, Viscosity, Turbulence, Pressure, Acceleration, Continuity) are then presented in a user-configurable dashboard for ease of monitoring.
💡 Note:
The “Market Fluid Dynamics - Phen” indicator is designed to offer a unique perspective on market behavior by applying principles from fluid dynamics. It’s most effective when used to understand the underlying forces driving price rather than as a direct buy/sell signal generator in isolation. Experiment with the settings, particularly the ‘Base Lookback Period’, ‘Flow Sensitivity’, and ‘Flow Smoothing’, to find what best suits your trading style and the specific asset you are analyzing. Always combine its insights with robust risk management practices.
Pressure

VolumeFlowOscillatorLibVolume Flow Oscillator Library
Overview
The Volume Flow Oscillator library provides a comprehensive framework for analyzing directional volume flow in financial markets. It creates a multi-band oscillator system that transforms price and volume data into a spectrum of sensitivity bands, revealing the underlying buying and selling pressure.
Technical Approach
The library combines price direction with trading volume to generate an oscillator that fluctuates around a zero line, with positive values indicating buying pressure and negative values showing selling pressure. Using sophisticated ALMA (Arnaud Legoux Moving Average) smoothing techniques with asymmetric sensitivity, the library creates seven distinct bands that help identify various intensity levels of volume flow.
Key Features
Multi-band oscillator system with seven sensitivity levels
Directional volume flow analysis combining price movement and volume
Zero-line oscillation showing the balance between buying and selling pressure
Asymmetric ALMA smoothing for different sensitivity on positive/negative bands
Customizable lookback periods and multipliers for fine-tuning
Color-coded visualization for intuitive chart reading
Applications
This library offers developers a versatile foundation for creating volume-based indicators that go beyond simple volume measurement to reveal the directional force behind market movements. Ideal for confirming price trends, detecting divergences, identifying volume climaxes, and assessing overall market strength.

Shifted Buy PressureDifferentiated Buy Pressure Indicator Documentation
Overview: The Differentiated Buy Pressure indicator is a custom Pine Script™ indicator designed to measure and visualize buy and sell pressure in the market. It calculates buy pressure based on a combination of volume, range, and gap, and provides a differentiated buy pressure which is shifted by 90°, offering predictive insights.
Inputs:
Window Size: The window size for average calculation (default: 20).
Show Overlay: Option to show the price overlay (default: false).
Overlay Boost Factor: Boosting factor for overlaying the price (default: 0.01).
Calculations:
Relative Range: Calculated as (high - low) / close.
Average Range: Simple moving average of the relative range over the specified window.
Average Volume: Simple moving average of the volume over the specified window.
Relative Gap: Calculated as open / close .
Average Gap: Simple moving average of the relative gap over the specified window.
Buy Pressure: Calculated using the formula: buy_pressure = -math.log(relative_range / avg_range * volume / avg_volume * relative_gap / avg_gap)
Differentiated Buy Pressure: Calculated as the difference between the current and previous buy pressure: diff_buy_pressure = buy_pressure - buy_pressure
Plots:
Zero Line: A horizontal line at zero for reference.
Buy Pressure: Plotted in blue, representing the calculated buy pressure.
Differentiated Buy Pressure: Plotted in red, representing the differentiated buy pressure.
Overlay: Optionally plots the price overlay boosted by the differentiated buy pressure.
Labels:
Labels are created to display the buy pressure and differentiated buy pressure values on the chart.
Usage: This indicator helps traders visualize the buy and sell pressure in the market. Positive values indicate buy pressure, while negative values indicate sell pressure. The differentiated buy pressure, shifted by 90°, provides predictive insights into future market movements.
This documentation provides a comprehensive overview of the Differentiated Buy Pressure indicator, explaining its purpose, inputs, calculations, and usage.

Enhanced Buy/Sell Pressure, Volume, and Trend Bar analysisEnhanced Buy/Sell Pressure, Volume, and Trend Bar Analysis Indicator
Overview
This indicator is designed to help traders identify buy and sell pressure, volume changes, and overall trend direction in the market. It combines multiple concepts like price action, volume, and trend analysis, candlestick anaysis to provide a comprehensive view of market dynamics. The visual elements are intuitive, making it suitable for traders at different levels. This indicator works together with Enhanced Pressure MTF Screener which is a screener based of this indicator to make it easier to see Bullish/Bearish pressures and trend across multiple timeframes.
Image below: is the Enhanced Buy/Sell Pressure, Volume, and Trend Bar Analysis with the Enhanced Pressure MTF Screener indicator both active together.
Key Features
1.Buy/Sell Pressure Identification
Buy Pressure: Calculated based on price movement where the close price is higher than the opening price.
Sell Pressure: Calculated when the closing price is equal to or lower than the opening price.These pressures help you understand whether buyers or sellers are more dominant for each bar.
2.Volume Analysis
Normalized Volume: Volume data is normalized, making it easier to compare volume levels over different periods.
Volume Histogram: The volume is also presented as a histogram for easy visualization, showing whether the current volume is higher or lower compared to the average.
3.Simplified Coloring Option
You can choose to simplify the coloring of bars to reflect the dominant pressure: green for bullish pressure and red for bearish pressure. This makes it visually easier to identify who is in control. When simplified coloring is disabled, the bars' colors will represent the combined effect of buy and sell pressure.
4.Heikin-Ashi Candles for Pressure Calculation
The indicator includes an option to use Heikin-Ashi candles instead of traditional candles to calculate buy and sell pressure. Heikin-Ashi candles are known for smoothing out price action and providing a clearer trend representation.
5.Trend Background Coloring
This feature uses exponential moving averages (EMAs) to determine the trend:
Short-Term EMA vs. Long-Term EMA: When the short-term EMA is above the long-term EMA, the trend is considered bullish, and vice versa.
The background color changes based on the identified trend: green for an uptrend and red for a downtrend. This feature helps visualize the overall market direction at a glance.
6.Signals for Key Price Actions
The indicator plots various symbols to signal important price movements:
Bullish Close (▲): Indicates a strong upward movement where the close price crosses above the open.
Bearish Close (▼): Indicates a downward movement where the close price falls below the open.
Higher High (•): Highlights new highs compared to previous bars, useful for confirming an uptrend.
Lower Low (•): Highlights lower lows compared to previous bars, which can indicate a downtrend or bearish pressure.
Calculations Explained
1.Buy and Sell Pressure Calculation
The buy pressure is determined by the price range (high - low) if the closing price is above the opening price, indicating an increase in value.
The sell pressure is similarly calculated when the closing price is equal to or below the opening price.
The indicator uses the Average True Range (ATR) for normalization. Normalizing helps you compare pressure across different periods, regardless of market volatility.
2.Volume Normalization
Volume Normalization: To make volume comparable across different periods, the indicator normalizes it using the Simple Moving Average (SMA) of volume over a user-defined length.
Volume Histogram: The histogram provides a clear representation of volume changes compared to the average, making it easier to spot unusual activity that may indicate market shifts.
3.Combined Pressure Calculation
The indicator calculates a combined pressure value by subtracting sell pressure from buy pressure.
When combined pressure is positive, buying is dominant, and when negative, selling is dominant. This helps in visually understanding the ongoing momentum.
4.Trend Calculation
The indicator uses two EMAs to determine the trend:
Short-Term EMA (default 14-period) to capture recent price movements.
Long-Term EMA (default 50-period) to provide a broader trend perspective.
By comparing these EMAs on a higher timeframe, the indicator can identify whether the trend is up or down, making it easier for traders to align their trades with the larger market movement.
Inputs and Customization
The indicator provides several options for customization, allowing you to adjust it to your preferences:
SMA Length: Determines the lookback period for moving averages and volume normalization. A longer length provides more smoothing, whereas a shorter length makes the indicator more responsive.
Buy/Sell/Volume Colors: Customize the colors used to represent buying, selling, and volume to suit your preferences.
Heikin Ashi Option: Toggle between using Heikin Ashi or traditional OHLC (Open-High-Low-Close) candles for pressure calculations.
Trend Timeframe and EMA Periods: You can choose different timeframes and EMA periods for trend analysis to suit your trading strategy.
How to Use This Indicator
Identifying Market Momentum: Use the buy/sell pressure columns to see which side (buyers or sellers) is in control. Positive pressure combined with green color indicates strong buying, while red indicates selling.
Volume Confirmation: Check the volume area plot and histogram. High volume coupled with strong pressure is a sign of conviction, meaning the current move has backing from market participants.
Trend Identification: The trend background color helps identify the overall trend direction. Trade in the direction of the trend (e.g., take long positions during a green background).
Signal Indicators: The plotted symbols like "Bullish Close" and "Bearish Close" provide visual signals of key price actions, useful for timing entry or exit points.
Practical use Example
Scenario: The market is consolidating, and you see alternating green and red bars.
Action: Wait for a consistent sequence of green bars (buy pressure) along with a green background (uptrend) to consider going long, although you can go long without having a green background, the background adds confirmation layer.
Scenario: The market has several bearish closes (red ▼ symbols) accompanied by increasing volume.
Action: This could indicate strong selling pressure. If the background also turns red, it might be a good time to exit long positions or consider shorting.
Higher timeframe pressure and volume: Another way to use the indicator is to check buy/sell volume and pressure of the higher timeframe say weekly or daily or any timeframe you consider higher, once you’ve identified or feel confident in which direction the bar is going along with the full picture of trend, you can go to the lower timeframe and wait for it to sync with the higher timeframe to consider a long or a short. It is also easier to see when markets sync up by also applying the Enhanced Pressure MTF Screener which works in companion to this indicator.
Visual Cues and Interpretation
Combined Pressure Plot: The green and red column plot at the bottom of the chart represents the dominance between buying and selling. Tall green bars signify strong buying, while tall red bars indicate selling dominance.
Trend Background: Helps visualize the overall direction without manually drawing trend lines. When the background turns green, it generally indicates that the shorter-term moving average has crossed above the longer-term average—a sign of a bullish trend.
To Summarize shortly
The Enhanced Buy/Sell Pressure, Volume, and Trend Bar Analysis Indicator is an advanced but simple tool designed to help traders visually understand market dynamics. It combines different aspects of market analysis of candle pressure from buyers and sellers, volume confirmation, and trend identification into a single view, which can assist both new and experienced traders in making informed trading decisions.
This indicator:
Saves time by simplifying market analysis.
Provides clear visual cues for buy/sell pressure, volume, and trend.
Offers customizable settings to suit individual trading styles.
Always, I am happy to share my creations with you all for free. If you guys have cool ideas you would like to share, or suggestions for improvements the comment is below and I hope this overview gave an idea of how to use the indicator :D

Discovery IndexThe Discovery Index is an original technical indicator which attempts to display directional market pressure and momentum based on accumulated candle-over-candle measurements.
Discovery , in this context, is the act of finding (discovering) New Highs and Lows.
> What is 'Discovery'
Not to be confused with "Price Discovery", the term for setting the spot price of an asset.
The term 'Discovery' in Discovery Index is used based on the literal definition of 'Discovery', such as, the action of finding what was previously unknown.
Given this definition,
Discovery is the difference between highs or lows only when the current high is higher than the previous high or the current low is lower than the previous low.
Below is a visual example of exactly where Discovery is seen from each candle.
Since discovery is only based on points of the candle, and not specifically the direction of the candle; it is possible for discovery to occur in both directions from the same candle.
It is also possible for no discovery to occur from a candle.
> Calculation
The Discovery Index is the Net Total of discovery data over a specified length of bars.
Discovery Index = Sum of Upwards Discovery + Sum of Downwards Discovery
Note: Upwards Discovery is always Positive, and Downwards Discovery is always Negative. By adding both together, their Net Total is produced. This value is the "Discovery Index".
Wick Calculation Example
> Volume Discovery
Using Volume for the Discovery Index Calculation allows for a different dimension to be added to the data for new analysis opportunities.
While volume data is only a single value, by accumulating this data over time, we are able to fabricate a candle body from the data by accounting for the direction of the chart candles.
This allows for the Calculation of the Discovery Index based on volume data.
Volume Example
> Display
The display uses a "Candlestick histogram" display. The bodies and wicks from the display represent the discovery data from the respective points in each candle. (Wick Discovery & Candle Body Discovery).
This style of histogram allows for the display of both data sources, preserving the accuracy and distinction between each type, while also providing a clean display.
> Considerations
Discovery index is not an Oscillator, since there are no upper or lower boundaries to its rotations.
There are not (at this time) any "Over-bought" or "Over-sold" Areas, this is partially due to the previous consideration since any levels for these could potentially change from chart to chart. Additionally, it would generally be better to read the data based on the context of the current market.
Non-directional movements effect the Discovery Index as well. Since Discovery does not occur from every bar, the Index reflects hesitations as well as movements in market direction.
With the option to input a symbol, the Discovery Index Indicator is not constrained to one chart ticker for its calculation and could help to see shifts between different symbols, making it easier to compare different assets.
With the separation of wicks and candle body data, a stronger move may be observed by its full-bodied movements, while a potentially more speculative move may be seen from large wick movements. Since wicks are often interpreted as either, Rejection for reversal OR as Testing for continuation, the interpretation for Wick Discovery generally varies based on context.
Discovery Index ⇾ Divergences! Due to its calculation, price (and/or volume) data is displayed in such a way that makes it useful as a tool for identifying divergence opportunities.
Remember, this indicator is lookback based. An immediate significant change from the data source (if not offset by a similar opposite change) will be represented for multiple bars after its occurrence. Due to this, data is likely to be skewed or biased from these occurrences for a period of time after.
Throughout development, "Discovery" has been shortened to just "Disco", therefore, this indicator is also an attempt to bring Disco Back.
Enjoy!

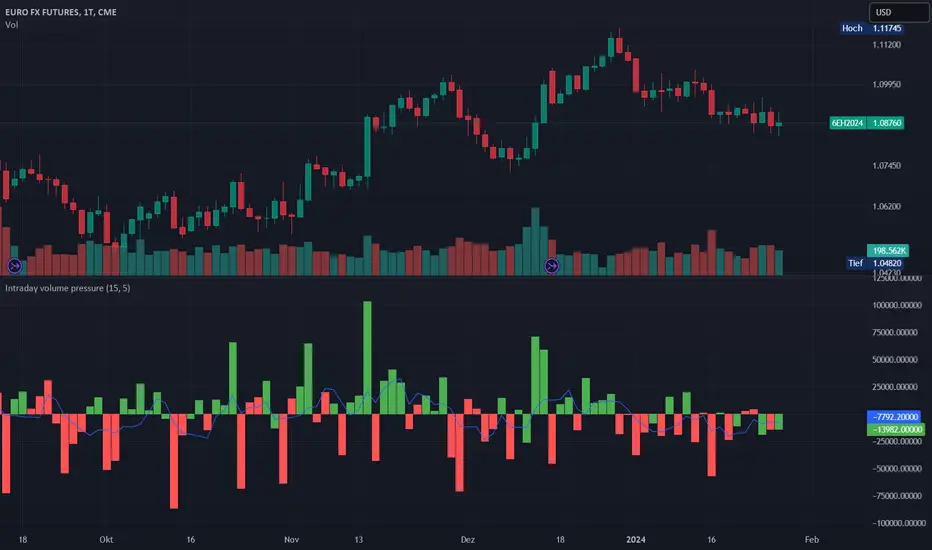
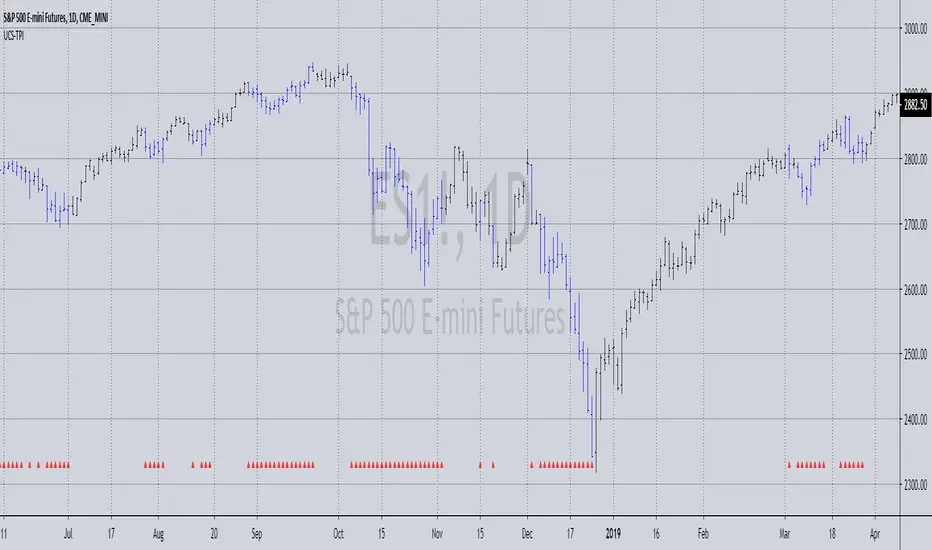
Intraday volume pressureThis indicator shows the difference of bullish and bearish trading volume during intraday
The idea
Especially in "6E1!" it caught my eye, that often outside regular trading hours the price moves in one direction with thin volume and inside regular trading hours it moves back with much higher volume. It is possible, that the market closes e.g. with a plus. And over some days maybe you can see e.g. weak rising prices. But in this time the movements with high volume are going down every day. And one day - maybe within view minutes - the market rushs a level deeper.
Maybe some are manipulating the market in this way, maybe not, it doesn't matter. So my question was, can I find a way to show such divergences? I guess I can do.
How to use this indicator
Use it at your own risk! I don't take over any responsibility. You are the only one, who is responsible for your decisions. Always collect information from different independent sources!
Watch it in the daily chart - not intraday, not weekly! Of course this indicator just analyzes the past as all indicators. Everytime everything may happen that influences the market in any direction, no indicator can predict any news.
Watch it in sideways market or when the price is moving quite slow over days! An average volume pressure
below zero shows a volume-driven bearish pressure
above zero shows a volume-driven bullish pressure
of the last days. So there is a chance, that the market may follow the volume pressure within the next days. But of course, I cannot guarantee anything. The indicator just can give you an idea, why this will happen, when it will happens. Otherwise, the indicator indicated nothing helpfull.
Of course you also can try other securities. Maybe it will work there better or worse - difficult to say. I guess, it depends on the market.
Possible settings aside of colors
Intraday minute bars: Default is 15 minutes, in 6E in my point of view it is a good value. If you choose a smaller value, the chart gets too noisy, the results are getting too small. With a bigger timeframe some moves are hidden in bigger candles, the results are getting a large spread
Average over days: Default is 5 days - so one week. In 6E in my point of view it is a good value. A smaller value is too noisy. A bigger value reacts too slow. Often 6E has a trend over weeks. Sometimes it changes within some days - the indicator may help. But sometimes the market changes with a buying or selling climax. Such a case this indicator cannot recognize. But with the 5 days average maybe you get a change in the indicator within one or two days. Anyway, it is always a good idea to learn recognizing climaxes otherwise.
How the indicator works
It uses the function request.security_lower_tf to get the intraday candles. The volume of intraday up-candles is added to the intraday summary volume. The volume of down candles is substracted from the intraday summary volume.
In the oscillator area I plot a green bar on a day with a higher close than open and a red bar on a day with a lower close than open. The bar has a positive value, if the volume pressure is positive and a negative value if the volume pressure is negative. So it happens, that a green bar has a negative value or a red bar has a positive value.
The average is calculated with a floating sum. Once we have enough days calculated, I devide the floating sum by the length of the "Average over days" and plot the result. Then I substract the first value of the queue and I remove it.
Hull PressureThis amazing oscillator displays the difference between the hull average calculated on the close of the candles and the one calculated between the average of the highs and lows.
This allows the user to identify the pressure of the closing price over the average, useful to identify trends, divergences, and reversals.
This indicator also has two dynamic overbought and oversold areas, calculated over the past extreme highs and lows of the oscillator.

Buying and Selling Pressure Raw Multi (TG Fork)Visualize raw buying and selling pressure via 3 different calculation methods, all superimposed with dynamic rescaling.
Buying and selling pressure is the concept of quantifying the disproportion between buying and selling. In practice, there is no single definitive way to calculate it.
This indicator is a merge to display three different methods to calculate buying and selling pressure, with automatic visual rescaling to superimpose the three simultaneously, updated to PineScript v5, and with some additional improvements for speed and calculation precisions, and instead of the EMA, other types of moving averages can be used.
I primarily made it for my own needs, but as always, I like sharing with the community, as maybe others may find this useful too.
How to use:
* As often, the goal is to get as many of the 3 signals concur together to get a stronger aggregated signal.
* First signal: If the green bars on the histogram are bigger than the red ones, then there is more buying pressure, and vice versa.
* Second signal: If the background is green, there is more buying pressure, and vice versa if the background is orange. The yellow and green lines define the background color, but they are by default hidden for a less cluttered visual experience.
* Third signal: If the cloud is blue, there is more buying pressure, and the bigger the cloud, the more momentum there is for it to stay (and more difficult it is to reverse to selling pressure). If the cloud is red, there is more selling pressure.
If you like this indicator, please don't give me any credit, instead please show some love to the original authors (in no particular order):
ceyhun:
daytraderph (I could not find the link to the original script, the page is inaccessible?):
www.tradingview.com
fract:

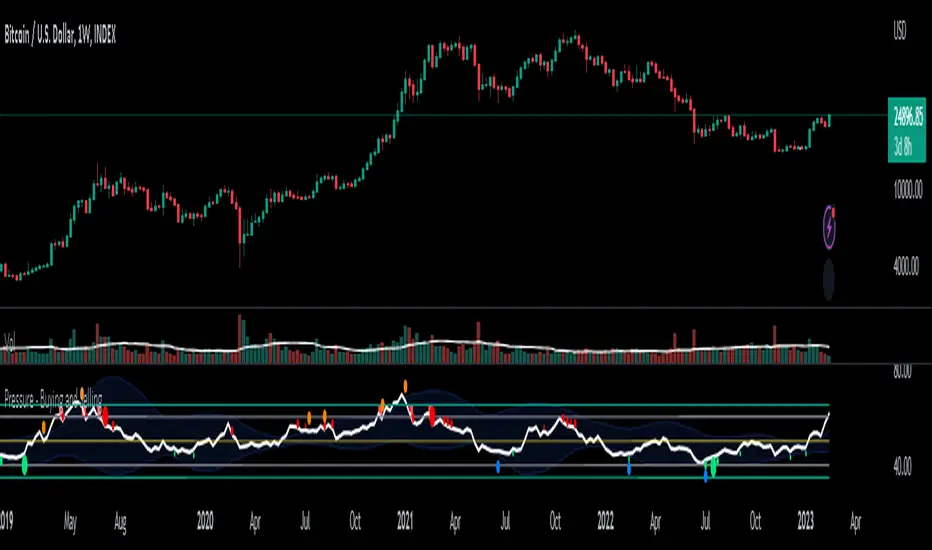
Pressure - Buying and SellingThis is the Pressure Indicator.
The Pressure Indicator analyzes a number of price ratios to measure the pressure of Buyers and Sellers.
I’ve also added to the indicator:
1) Moving Averages (MA) – You can choose 3 types of MA:
- Simple Moving Average (SMA)
- Exponential Moving Average (EMA) - default
- Volume Weighted Moving Average (VWMA)
- Arnaud Legoux Moving Average (ALMA)
By default the MA are not displayed. You can turn them on or off.
2) Standard Deviation Bands and MA Bands – Bands only for the MA type 1 selection. Usually, the Pressureis inside the Bands. If it is beyond the Bands that could mean the current trend is ending. The MA Bands are turned off by default but you can turn them on the Styles Tab Menu.
3) Levels for Overbought and Oversold Zones:
- Gray Overbought 60
- Gray Oversold 40
4) Levels for Buying and Selling Pressure (3 types of pressure + 1 more). If the Pressure is crossing various intermediate levels that means there is Buying or Selling Pressure at those levels.
5) Signals for Crossing Overbought and Oversold Levels:
- Top Red fills for Crossing Down Overbought Level
- Bottom Lime fills for Crossing Up Oversold Level
6) Signals for Buying and Selling Pressure:
- Buy Pressure 1 and 2 are the smaller lime dots.
- Buy Pressure 1 and 2 together are the bigger lime dots.
- Buy Pressure 3 (Crossing Deviation Bands Up) are the blue dots.
- Sell Pressure 1 and 2 are the smaller red dots.
- Sell Pressure 1 and 2 together are the bigger red dots.
- Sell Pressure 3 (Crossing Deviation Bands Down) are the orange dots.
If there are more than one dot appearing at the same moment they will appear displaced in a vertical way at the same time.
If there is something wrong with the code or its calculations, please let me know.
If you want to modify or improve the code, feel free to do that, but please let me know the changes you made.
This Indicator is very accurate when using the Weekly Timeframe . I hope you enjoy it!
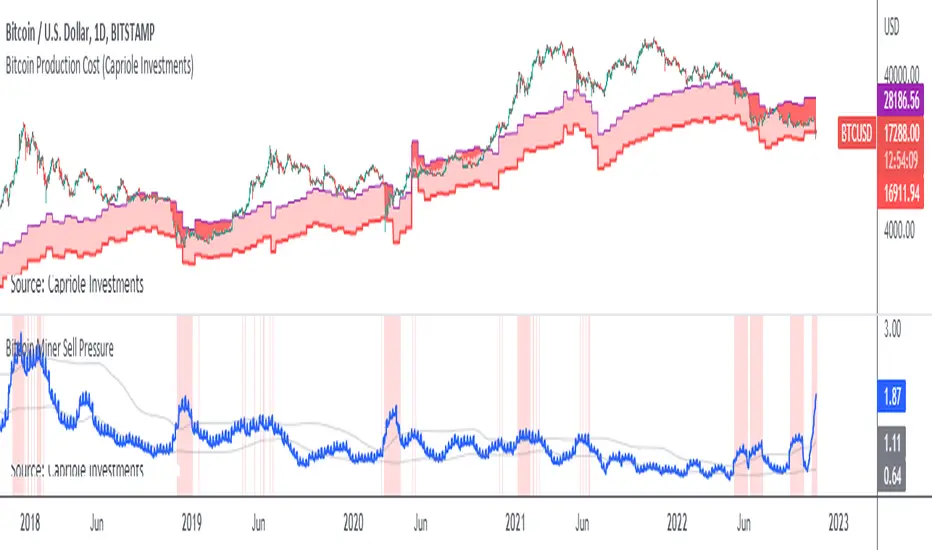
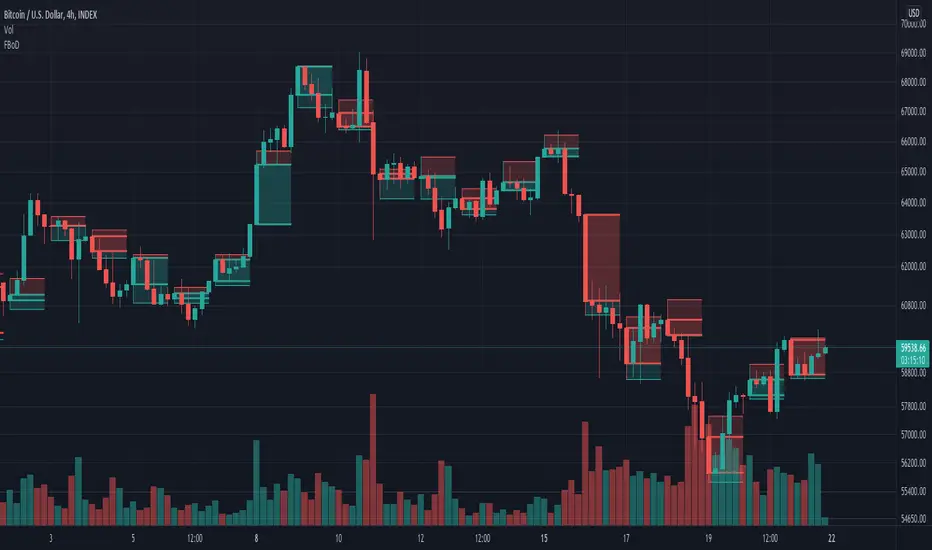
Bitcoin Miner Sell PressureBitcoin miners are in pain and now (November 2022) selling more than they have in almost 5 years!
Introducing: Bitcoin Miner Sell Pressure.
A free, open-source indicator which tracks on-chain data to highlight when Bitcoin miners are selling more of their reserves than usual.
The indicator tracks the ratio of on-chain miner Bitcoin outflows to miner Bitcoin reserves.
- Higher = more selling than usual
- Lower = less selling than usual
- Red = extraordinary sell pressure
Today , it's red.
What can we see now ?
Miners are not great at treasury management. They tend to sell most when they are losing money (like today). But there have been times when they sold well into high profit, such as into the 2017 $20K top and in early 2021 when Bitcoin breached $40K.
Bitcoin Miner Sell Pressure identifies industry stress, excess and miner capitulation.
Unsurprisingly, there is a high correlation with Bitcoin Production Cost; giving strong confluence to both.
In some instances, BMSP spots capitulation before Hash Ribbons. Such as today!
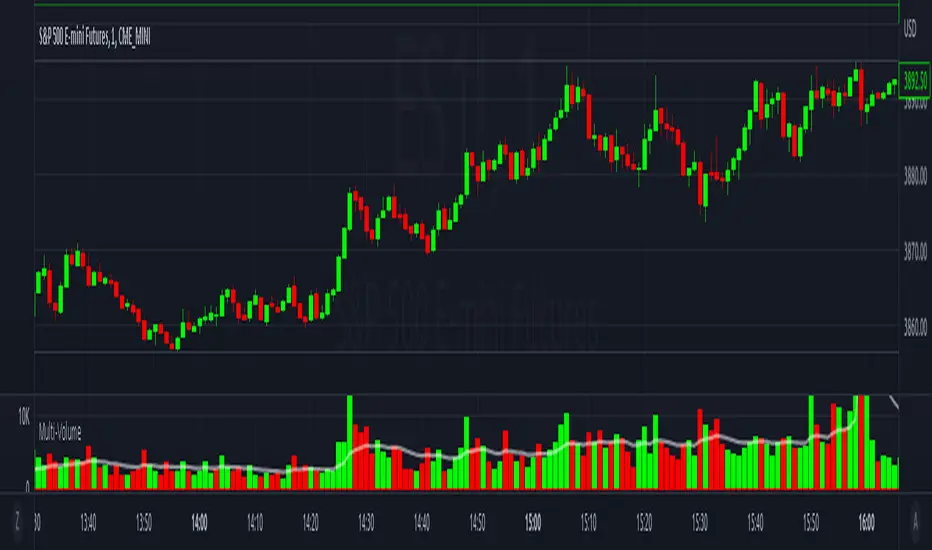
Multi-VolumeThis indicator displays volume in several formats:
Volume Bar Format:
Normal Volume: Shows the normal volume bar colors based on each candle's price direction
Up/Down Volume: Breaks down each volume bar into buying volume (volume added when price goes up) and selling volume (volume added when price goes down)
Volume Pressure: Breaks down each volume bar based on the length of the candle and its "pressure wick". See below for more information.
Flip Down Volume:
The down volume bar will be displayed below the center line.
Show Delta:
When selected with "Up/Down Volume" or "Volume Pressure", a small line will be displayed at the net volume (difference between up and down volume).
Projected Volume:
Instead of current volume, it will show expected volume at end of candle based on volume per second.
Volume Pressure:
On a green candle:
The red part represents the upper wick, the volume as the price comes back down from its high
The green part represents the rest of the candle, the volume as the price goes up from its low to the close
On a red candle:
The green part represents the lower wick, the volume as the price comes back up from its low
The red part represents the rest of the candle, the volume as the price goes down from its high to the close
To Update to Latest Version:
To update to the latest version, just close the indicator and add it again.
Volume Risk Avoidance IndicatorPrice Pattern Analysis is the core of trading. But price patterns often fails.
VRAI (Volume Risk Avoidance Indicator) shows Volume Pressure, so that you can avoid volume-based risks.
For example, never short when you see green (buying pressure). Never long when you see red (selling pressure).
You still need to pick good price patterns, because the crossover of volume pressure is not reliable.
Enjoy!

Wick Pressure by SiddWolfMultiple Wicks forming at OverSold & OverBought levels create Buying and Selling Pressure. This Script tries to capture the essence of the buy and sell pressure created by those wicks. Wick pressure shows that the trend is Exhausted.
How it works:
This Wick Pressure Indicator checks for three candles forming the wicks in overbought and oversold zones. The zones are set by RSI and can be changed in settings. Those three candles should form a bit long wick and length of the wick is determined by ATR. The ATR multiple can be changed from settings. And then the script draws a box in the area formed by three candle wicks.
Confluence:
This indicator should not be used on its own. You should include it in your existing trading strategy. Any indicator should be rigorously tested before making any real trades.
Settings is the Key:
Settings are key to all of my indicators. Play around with it a bit. Change the ATR multiplier. Read the tooltips to understand what each settings mean. Tooltips are the (i) button in-front of each settings.
FAQs:
Q. Does the indicator Repaint ?
--- No. None of my indicators repaints. What you see now is what's drawn in real time.
Q. Indicator doesn't show anything ?
--- Maybe you've messed up the settings so reset it. or try different coin/stock.
Q. Does this indicator give financial advice?
--- No. Nope. Nein. Não. नहीं.
Conclusion:
This indicator is very basic but if used correctly it can be very powerful. Hit me up if you'd like to see the screener/scanner for this or any of my indicators. If you have any questions or suggestions feel free to comment below. I'd love to connect with you. Thank you.
~ SiddWolf

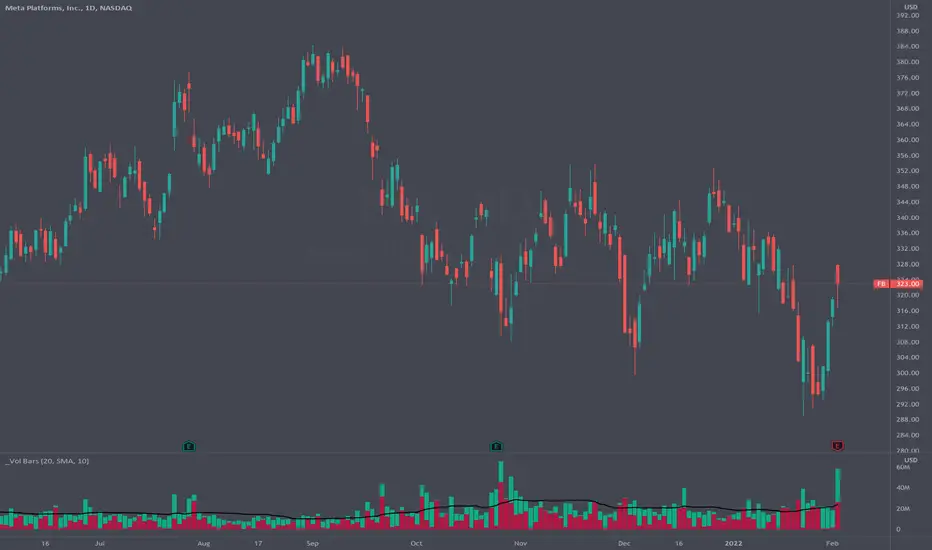
Volume Pressure BarsDescription
This indicator transforms the normal volume bars into buying and selling segments. This allows the user to easily see how much buying and selling pressure is occurring on any given timeframe. The buying and selling pressure values are calculated using the following equations:
buyingPressure = volume * (close - low) / (high - low)
sellingPressure = volume * (high - close) / (high - low)
Moving Average Line
Also included in this indicator is the optional moving average line. This allows the user to easily see if volume is above or below the average line. All aspects of the moving average line can be adjusted. The line can be toggled on & off, the length of the moving average can be adjusted, the mathematical smoothing function can be chosen, and the color & style of the line can be configured.
Scaling
If the volume pressure bars are displayed on the same “pane” as the price candles, then the volume bars can be scaled up or down. In the Input settings check the “Scale Bars” checkbox. Then increase the “Scaling Factor” number to make all of the volume bars smaller (to allow more room on your chart) or decrease the number to make the volume bars bigger.
IMPORTANT NOTE #1: scaling only works when the volume pressure bars are in the same pane as the price candles. If the volume pressures bars are in their own pane, then the “Scale Bars” toggle has no effect.
IMPORTANT NOTE #2: if the volume pressure bars are in the same pane as the price candles then there will be a sizable gap between the bottom of the volume bars and the time axis on the TradingView chart. This IS NOT a bug in this indicators code. The gap IS a bug in the TradingView platform that affects all volume indicators besides the default volume indicator that comes with each blank chart. To remove the gap then move the “_Vol Bars” indicator to its own pane above or below the main pain.
Volume Numbers
In Pine Script there is not a true stacked bar chart plot. What the author has to use are multiple bar charts that are in front and behind each other. This gives the impression that the bars are truly stacked because the selling pressure is always smaller than the total volume on any given bar. There is no issue to visually look at the bars and see their heights but if the user used their cursor to hover on a bar to get the actual volume pressure values it leads to issues. To address this problem the author has created a third invisible bar called “Buy Vol Label” that is the buy pressure volume value. Thus when the user hovers the cursor over a bar the first value (from left to right) is the total volume for the bar, the second value is the sell pressure, the third value is the buy pressure, and the fourth value (if toggled on) is the moving average value.
Volume Pressure AnalysisVolume Pressure Analysis is a new concept I have been working on designed to show the effort required to move price. An ideal tool for confirming trends or locating reversals early. This indicator can highlight whale action and market manipulation. It calculates volume vs volatility and displays the results as a meter:
Above 0 shows how easy price action is traveling, the bigger these bars the less volume and effort is required to push price. These are indicated with a teal or red arrows and can confirm the beginning or continuation of a trend. This is the natural direction the chart wants to travel at that time.
Below 0 shows how hard price is to move. The bigger these bars the more volume and effort is required to push price. When whales and market makers push price against its will these bars will get bigger.
Yellow arrows signal pressure in that direction and excessive amounts of volume is required to move price. These signals can lead to reversal/ pivot points as price action struggles to continue its trend. These signals can be turned on in settings or use the overlay version of this script to display signals on chart. This is a very powerful tool when used with relative volume.

Volume Pressure Analysis - OverlayVolume Pressure Analysis is designed to show effort required to move price. This script is the overlay version that displays signals on the candles as well as changes the bar colors. Yellow arrows signal pressure in that direction and excessive amounts of volume is required to move price. These signals can lead to reversal/pivot points as price action struggles to continue its trend. Red and teal arrows indicate free flowing price action where very little effort or volume is needed to push price. These signals can confirm the beginning or continuation of a trend and is the natural direction the chart wants to travel at that time. For more information please check out the main Volume Pressure Analysis indicator.

Trader Pressure Index (TPX)This is my take on the script by RedK
I kept the algorithm exactly the same, but changed the layout and the default look back period. Most important is that the resulting line, the TPX, is now a histogram with green and red staves.
To put the histogram on a logical place in the graph, I changed the way the control/dominance level is implemented, it now lowers or highers the whole graph, this way the zero level becomes the ‘no interest’ level.
I added two horizontal lines at a distance of 40 because I feel that this is sort of an oversold / overbought indication. In practice not very convincing, but provides a visual comparison.
In this layout I explain that grass is growing on bull hills peaking up behind the foreground and blood is dripping from the bear hills.
Enjoy.

Stoch X, an Indicator of Indicators by DGTStochastic refers to a randomly determined process and financial markets use stochastic models to represent the seemingly random behaviour of assets and then used by quantitative analysts to value options on asset prices
The stochastic oscillator, developed by George Lane, presents the location of the closing price of a stock in relation to the high and low range of the price of a stock over a period of time. Lane has said that the stochastic oscillator does not follow price or volume or anything similar. He indicates that the oscillator follows the speed or momentum of price.
Traditionally, readings over 80 are considered in the overbought range, and readings under 20 are considered oversold. Please note that, very strong trends can maintain overbought or oversold conditions for an extended period and traders should look to changes in the stochastic oscillator for clues about future trend shifts. It is advised to check the higher timeframe of your trading timeframe and see where you are in the “big picture”
Signal crosses , intersection of stochastic and its signal line is considered to be a signal that a reversal may be in the works
Divergence between the stochastic oscillator and trending price action is also seen as an important reversal signal
Lane also reveals in interviews that, as a rule, the momentum or speed of the price of a stock changes before the price changes itself . In this way, the stochastic oscillator can be used to foreshadow reversals when the indicator reveals bullish or bearish divergences. This signal is the first, and arguably the most important, trading signal Lane identified.
What is Stochastic X ?
Stochastic X , is essentially an indicator of an indicator, providing stochastic calculation to some of well known indicators, such as RSI, MFI, OBV, etc. This means that it is a measure of selected specific indicator relative to its own high/low range over a user defined period of time.
Features of Stoch X
1- Displays Stoch of and indicator plus a companion indicator (companion display can be disabled from user dialog box)
Available options
Stoch Source plus PM A, where Source is close price and PMA refers to Price Distance to its Moving Average (for further details you may check my study of Price Distance to its MA by DGT, and different application of distance concept available with “MACD-X, More Than MACD" And “P-MACD”)
Stoch RSI plus RSI , Stoch RSI, developed by Tushar Chande and Stanley Kroll, is a build-in indicator available on Trading View, where Stoch X adds RSI as a companion indicator to Stoch RSI
Stoch MFI and MFI , where MFI is Money Flow Index, measures buying and selling pressure through analyzing both price and volume
Stoch OBV + VO , Where OBV is On Balance Volume, is a momentum indicator that measures positive and negative volume flow. VO stands for Volume Oscillator which aims to confirm a market turnaround or trend reversal
Stoch EWO + EWO , EWO stands for Elliott Wave Oscillator
By default the threshold levels are indicated and are displayed differently for the regular Stoch or Stoch RSI. Overbought band (70-80), oversold band (20-30) and middle line (0) are emphasized
Warning : Centered Oscillators base line is moved from 0 to 50 to better suit with Stoch X, which is applied to PMA, VO and EWO
2- Can be plotted along with Stoch in the same window using the same scaling
To avoid misinterpreting the area between Stoch X and its Signal Line is highlighted automatically in case Stoch is selected to be plotted
3- Squeeze Indicator added as Add-on in the bottom of the Stoch X
During volatile market conditions the stochastic oscillator has been known to produce false signals. One way to help with this is to take the price trend as a filter, or basic chart pattern analysis can help to identify major, underlying trends and increase the Stoch X's accuracy.
This study implements Squeeze Indicator to help and add additional insight for filtering false signals. Blue diamond shapes indicates the squeeze release, that is volatility increased and according to momentum direction the buy/sell possibility can be considered. Orange ones displays consolidation periods, that is low volatility and the market is assumed to be in squeeze and no trade is recommended. in this phase.
Disclaimer: Trading success is all about following your trading strategy and the indicators should fit within your trading strategy, and not to be traded upon solely
The script is for informational and educational purposes only. Use of the script does not constitutes professional and/or financial advice. You alone the sole responsibility of evaluating the script output and risks associated with the use of the script. In exchange for using the script, you agree not to hold dgtrd TradingView user liable for any possible claim for damages arising from any decision you make based on use of the script

UCS_Trader Pressure Indicator -V1Welcoming everyone to a simple Indicator. I have used the volume of a stock to establish how commited the market for that particular ticker is when it comes to a direction.
The idea behind the indicator is how much of commitment there is towards a move.
*** This indicator is non directional*** ie., It just measures the commitment behind a move.
Why is it important.
Let's say we have a uptrending stock with low commitment (pressure), the bounce on any pullback will not be able carry that any further. So the pressure on the Pullback could drop the stock below and add additional risk. Only for us to wish and think, we checked that previously.
Essentially, If a Trend is being established with a strong pressure (VOLUME BASED). It is more likely to continue.
How you would use this is upto you. But general ideas in Some of these snapshots.
Concluding -
The trend in combination with TPI - Stronger Trend.
In such stronger trends - A pullback (oppsing the trend) have higher probability to bounce.
NOTE - Experiement with the indicator and Trade at your own risk This is a tool, not a system.
Feedbacks are welcome and will be considered for improvement.
Best Wishes
How to Overlay First LTF Bar of DayExample how to overlay the first lower timeframe bar of the day across the entire day. Set chart to a timeframe that is lower than 1 Day period. Also included option for coloring wick pressure of that bar.
NOTICE: This is an example script and not meant to be used as an actual strategy. By using this script or any portion thereof, you acknowledge that you have read and understood that this is for research purposes only and I am not responsible for any financial losses you may incur by using this script!
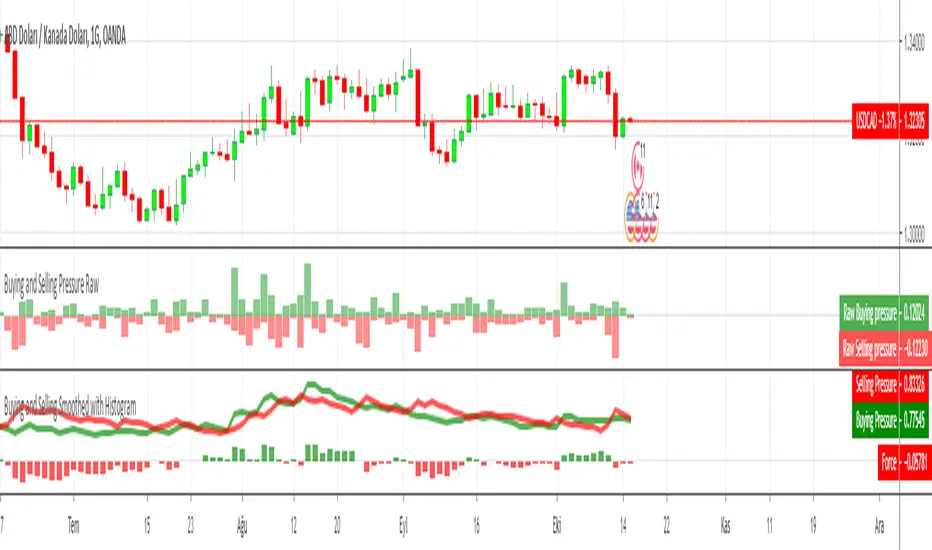
Buying and Selling Pressure RawBuying and Selling Pressure Raw
Raw Buying and selling pressure Indicator. The Raw buying and selling indication is provided in terms of a Columns.
Green bars above zero show the buying pressure and the red bars below the zero line show the selling pressure.
This presents a good visual representation of the dominating pressure.
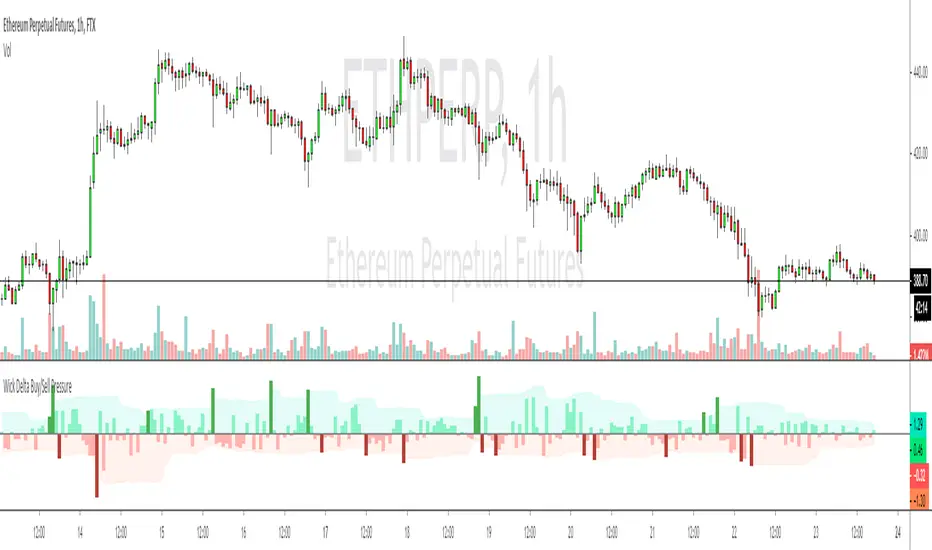
Wick Delta Buy/Sell PressureIf you think of a perfect doji candle, where the wicks on top and bottom are exactly the same, that's a candle with a delta of 0. What this indicator does is show the delta/difference between wicks, if the top wick is longer than the bottom wick it show's sell pressure/bear interest, which is displayed as a red bar and vice versa for buy/bull pressure, which is shown as green bars. I added arrows for clarity.
It's a different way of visualising wicks, which can clarify sentiment and be a useful way to understand wicks better in general. One way to use it is to look for clusters of 3/4 larger bars in a row, which generally helps to determine future direction especially when seen at important levels.
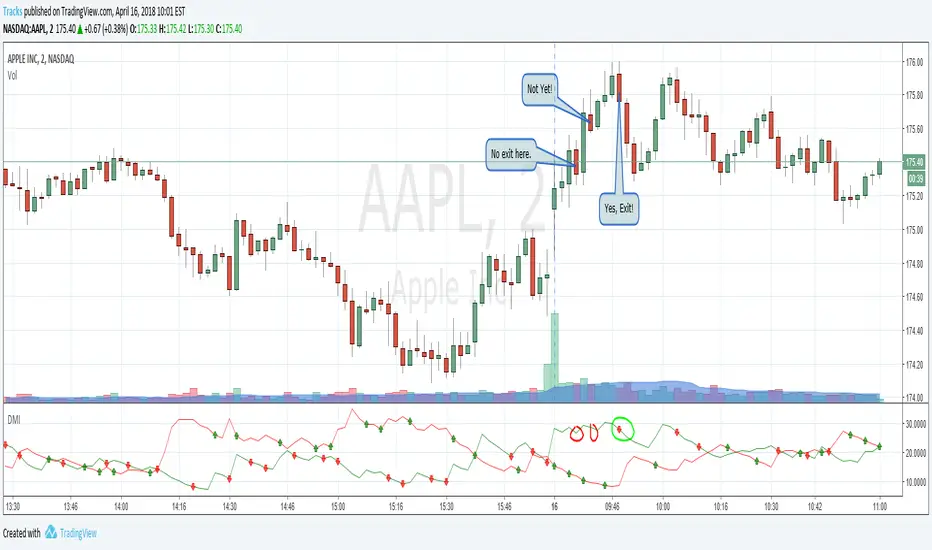
Directional Movement Index ConfirmationThis indicator helps determine the exit point of a play. Lots of green candles making you money? Got one red candle and now you're worried if this is the top? Check this indicator! A red arrow helps confirm that bearish pressure is rising while bull pressure is declining, and this may be your chance to exit. Works the opposite way for short plays, giving a green candle to help confirm the bottom.
This indicator was written to help educate members over at OptionsPlayers.com