OPEN-SOURCE SCRIPT
SMA Comparison with Buy and Sell Signals Shrut
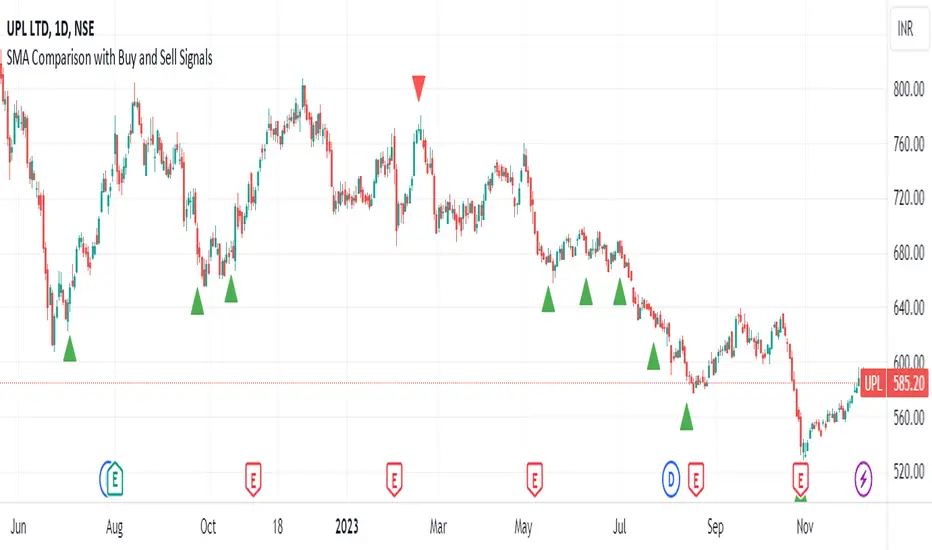
Indicator Name: SMA Comparison with Buy and Sell Signals
Overlay: Enabled (Indicator is displayed on the main price chart)
Description:
The "SMA Comparison with Buy and Sell Signals" indicator is designed to identify potential buying and selling opportunities in a financial instrument by comparing three Simple Moving Averages (SMAs) – the 20-day SMA, 50-day SMA, and 200-day SMA.
Features:
Simple Moving Averages (SMAs):
Calculates and displays three SMAs based on the closing price: SMA-20, SMA-50, and SMA-200.
Buy and Sell Conditions:
Buy Condition: Triggered when the 200-day SMA is greater than the 50-day SMA, the 50-day SMA is greater than the 20-day SMA, and the current closing price is lower than the 20-day SMA.
Sell Condition: Triggered when the 200-day SMA is less than the 50-day SMA, the 50-day SMA is less than the 20-day SMA, and the current closing price is higher than the 20-day SMA.
Signal Generation:
Generates buy and sell signals on the chart based on the identified conditions.
Implements a 15-day cooldown period between consecutive buy or sell signals to prevent frequent signals in volatile market conditions.
Signal Display:
Displays buy signals as green triangle shapes below the price bars.
Displays sell signals as red triangle shapes above the price bars.
Usage:
Buy Signals: Considered when the green triangle shapes (buy signals) appear below the price bars, indicating a potential buying opportunity based on the defined SMA conditions.
Sell Signals: Considered when the red triangle shapes (sell signals) appear above the price bars, indicating a potential selling opportunity based on the defined SMA conditions.
Notes:
This indicator is customizable and can be adjusted by modifying the conditions based on specific trading strategies and preferences.
Traders should consider additional analysis and risk management strategies before making trading decisions based solely on the indicator signals.
開源腳本
秉持TradingView一貫精神,這個腳本的創作者將其設為開源,以便交易者檢視並驗證其功能。向作者致敬!您可以免費使用此腳本,但請注意,重新發佈代碼需遵守我們的社群規範。
免責聲明
這些資訊和出版物並非旨在提供,也不構成TradingView提供或認可的任何形式的財務、投資、交易或其他類型的建議或推薦。請閱讀使用條款以了解更多資訊。
開源腳本
秉持TradingView一貫精神,這個腳本的創作者將其設為開源,以便交易者檢視並驗證其功能。向作者致敬!您可以免費使用此腳本,但請注意,重新發佈代碼需遵守我們的社群規範。
免責聲明
這些資訊和出版物並非旨在提供,也不構成TradingView提供或認可的任何形式的財務、投資、交易或其他類型的建議或推薦。請閱讀使用條款以了解更多資訊。