OPEN-SOURCE SCRIPT
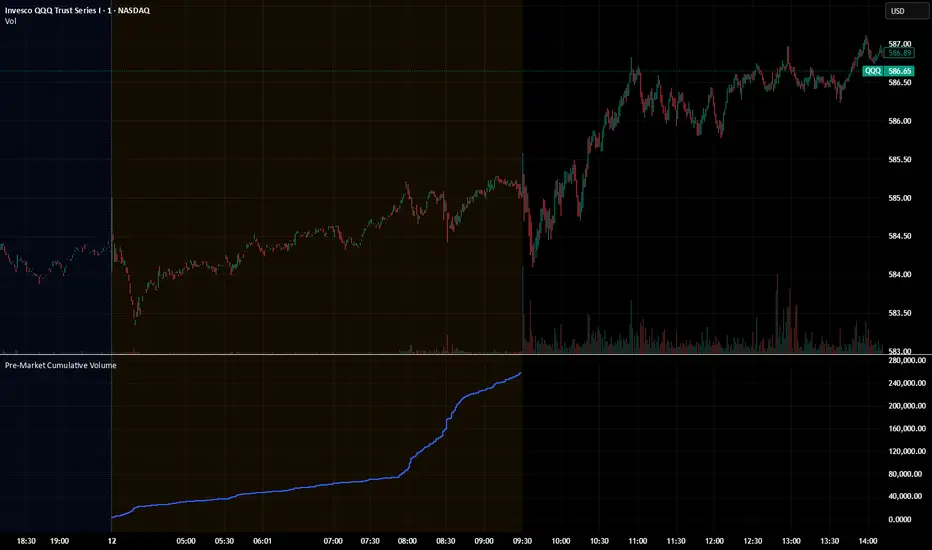
Pre‑Market Cumulative Volume
Description:
This indicator plots the cumulative trading volume for the pre‑market session on intraday charts. It automatically detects when a bar is part of the extended pre‑market period using TradingView’s built‑in session variables, starts a new running total at the first pre‑market bar of each day, and resets at the beginning of regular trading hours. During regular market hours or the post‑market session, the indicator does not display values.
To use this script effectively, ensure extended‑hour data is enabled on the chart, and select an intraday timeframe where pre‑market data is available. The result is a simple yet powerful tool for monitoring cumulative pre‑market activity.
How to use
Add the script to a chart and make sure you are on an intraday timeframe (e.g., 1‑min, 5‑min). Extended‑hour data must be enabled; otherwise session.ispremarket will always be false.
During each pre‑market session, the indicator will reset at the first pre‑market bar and then accumulate the volume of subsequent pre‑market bars.
Outside the pre‑market (regular trading hours and post‑market), the plot outputs na, so it does not draw on those bars.
Customization (optional)
If you want to define your own pre‑market times instead of relying on TradingView’s built‑in session, you can replace the isPreMarket line with a time‑range check. For example, isPreMarket = not na(time(timeframe.period, "0400-0930")) detects bars between 04:00 and 09:30 (U.S. Eastern time). You can parameterize the session string with input.session("0400-0930", "Pre‑Market Session") to let users adjust it.
開源腳本
秉持TradingView一貫精神,這個腳本的創作者將其設為開源,以便交易者檢視並驗證其功能。向作者致敬!您可以免費使用此腳本,但請注意,重新發佈代碼需遵守我們的社群規範。
免責聲明
這些資訊和出版物並非旨在提供,也不構成TradingView提供或認可的任何形式的財務、投資、交易或其他類型的建議或推薦。請閱讀使用條款以了解更多資訊。
開源腳本
秉持TradingView一貫精神,這個腳本的創作者將其設為開源,以便交易者檢視並驗證其功能。向作者致敬!您可以免費使用此腳本,但請注意,重新發佈代碼需遵守我們的社群規範。
免責聲明
這些資訊和出版物並非旨在提供,也不構成TradingView提供或認可的任何形式的財務、投資、交易或其他類型的建議或推薦。請閱讀使用條款以了解更多資訊。