INVITE-ONLY SCRIPT
已更新 SKYNET buy/sell 2.0
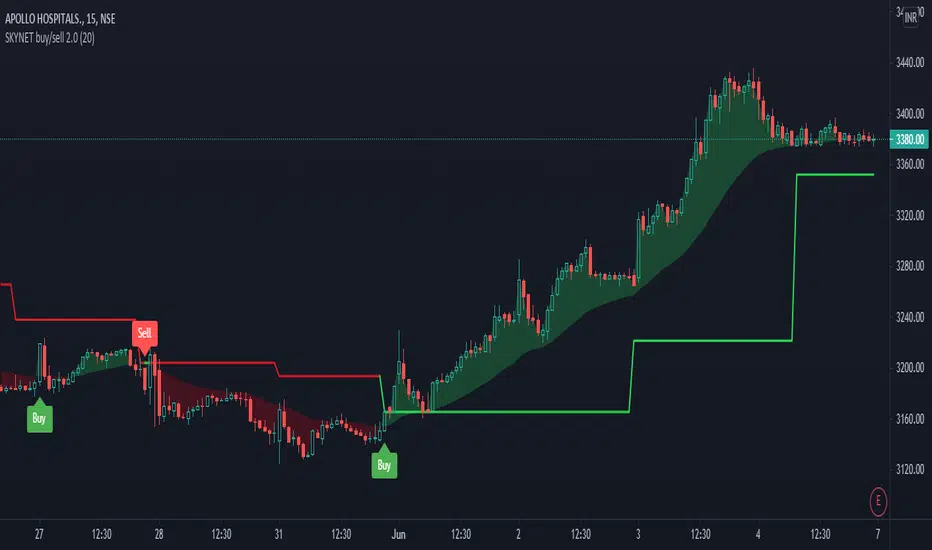
The SKYNET buy/sell 2.0 indicator generates buy and sell signals based on the following conditions:
**Anchor line : This anchor line is calculated based on certain parameters.
The anchor line is calculated in such a way that the stock/instrument moves around this anchor line.
The calculation of the anchor line uses a look back period which is set to 9 by default. The user can go to the indicator settings and change it to suit their trading style.
Note:
1) As the look back period increases, the number of signals generated on the chart decreases.
2) This indicator will only work on charts/stocks/instruments which are actually traded in the market i.e actual contracts of the stock/instrument is traded in the market. Hence, it will not work on indexes.
BUY signal: When the stock/instrument deviates to the upside of the anchor line by a specific margin, the Buy signal is generated.
SELL signal: When the stock/instrument deviates to the downside of the anchor line by a specific margin, the Sell signal is generated.
Disclaimer: This indicator is not 100% accurate and false signals are generated from time to time. Trading in the markets involves huge risks and one should always do his/her own research before making any trading decisions. This indicator is only designed to help you make a trading decision.
發行說明
**We have changed the default value for the "Anchor line lookback period" from 9 to 20.發行說明
**The indicator has been customized to work better on longer time frames.發行說明
** The minimum value for the "Anchor line lookback" period was increased to 9.發行說明
++ Trendline has been added to filter out false signals. A buy signal is valid if it is generated above the trendline and similarly a sell signal is valid if it is generated below the trendline. If the price moves away significantly from the trendline, it indicates strong momentum in that direction.++ A time constraint has been added. The indicator script now runs between
9:30 to 1500.
發行說明
++ Minor bug fixed in the trendline code.發行說明
++ Minor bug fixed in the time constraint code.發行說明
++ Minor change in calculation of the trendline.發行說明
++ VISUAL TREND has been added to the indicator. WE can filter out false signals by using the signals and the VISUAL TREND together. The VISUAL TREND is established by using a couple of exponential moving averages with customized parameters and settings.
A buy signal is more likely to work if the VISUAL TREND is bullish.
A sell signal is more likely to work if the VISUAL TREND is bearish.
++ Time constraint has been removed to increase the efficiency of the indicator on cryptocurrency charts.
https://www.tradingview.com/x/l6SzG0sB/
僅限邀請腳本
只有經作者授權的使用者才能訪問此腳本,且通常需付費。您可以將此腳本加入收藏,但需先向作者申請並獲得許可後才能使用 — 點擊此處了解更多。如需更多詳情,請依照作者說明或直接聯繫skynet970。
除非您完全信任其作者並了解腳本的工作原理,否則TradingView不建議您付費或使用腳本。您也可以在我們的社群腳本中找到免費的開源替代方案。
作者的說明
You can get the access to this indicator by leaving me a private message on TradingView.
Here are the links to some videos related to the indicator:
https://youtu.be/RntgcMAMnc0
提醒:在請求訪問權限之前,請閱讀僅限邀請腳本指南。
免責聲明
這些資訊和出版物並不意味著也不構成TradingView提供或認可的金融、投資、交易或其他類型的意見或建議。請在使用條款閱讀更多資訊。