OPEN-SOURCE SCRIPT
已更新 VWMA/SMA Delta Volatility (Statistical Anomaly Detector)
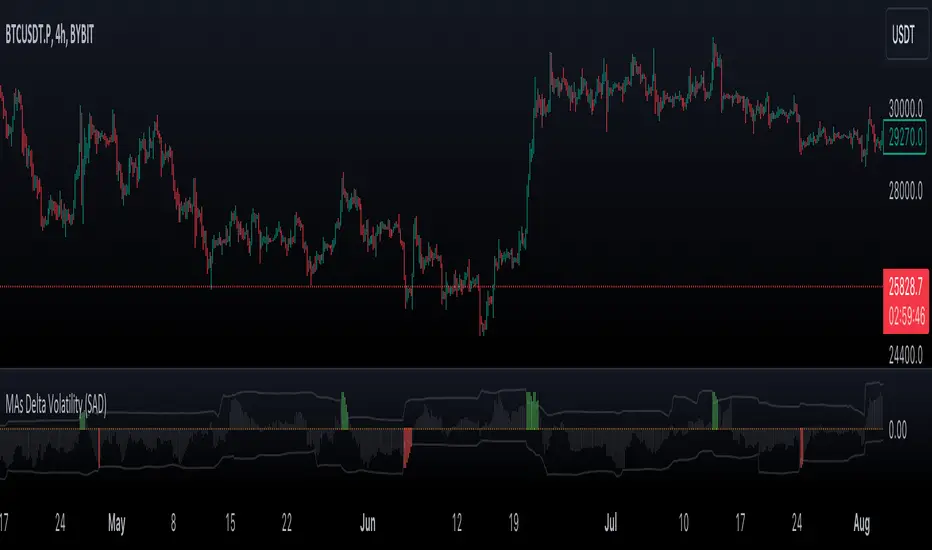
The "VWMA/SMA Delta Volatility (Statistical Anomaly Detector)" indicator is a tool designed to detect and visualize volatility in a financial market's price data. The indicator calculates the difference (delta) between two moving averages (VWMA/SMA) and uses statistical analysis to identify anomalies or extreme price movements. Here's a breakdown of its components:
Hypothesis:
The hypothesis behind this indicator is that extreme price movements or anomalies in the market can be detected by analyzing the difference between two moving averages and comparing it to a statistically derived normal distribution. When the MA delta (the difference between two MAs: VWMA/SMA) exceeds a certain threshold based on standard deviation and the Z-score coefficient, it may indicate increased market volatility or potential trading opportunities.
Calculation of MA Delta:
The indicator calculates the MA delta by subtracting a simple moving average (SMA) from a volume-weighted moving average (VWMA) of a selected price source. This calculation represents the difference in the market's short-term and long-term trends.
Statistical Analysis:
To detect anomalies, the indicator performs statistical analysis on the MA delta. It calculates a moving average (MA) of the MA delta and its standard deviation over a specified sample size. This MA acts as a baseline, and the standard deviation is used to measure how much the MA delta deviates from the mean.
Delta Normalization:
The MA delta, lower filter, and upper filter are normalized using a function that scales them to a specific range, typically from -100 to 100. Normalization helps in comparing these values on a consistent scale and enhances their visual representation.
Visual Representation:
The indicator visualizes the results through histograms and channels:
In summary, the "MA Delta Volatility (Statistical Anomaly Detector)" indicator aims to help traders identify abnormal price movements in the market by analyzing the difference between two moving averages and applying statistical measures. It can be a valuable tool for traders looking to spot potential opportunities during periods of increased volatility or to identify potential market anomalies.
Hypothesis:
The hypothesis behind this indicator is that extreme price movements or anomalies in the market can be detected by analyzing the difference between two moving averages and comparing it to a statistically derived normal distribution. When the MA delta (the difference between two MAs: VWMA/SMA) exceeds a certain threshold based on standard deviation and the Z-score coefficient, it may indicate increased market volatility or potential trading opportunities.
Calculation of MA Delta:
The indicator calculates the MA delta by subtracting a simple moving average (SMA) from a volume-weighted moving average (VWMA) of a selected price source. This calculation represents the difference in the market's short-term and long-term trends.
Statistical Analysis:
To detect anomalies, the indicator performs statistical analysis on the MA delta. It calculates a moving average (MA) of the MA delta and its standard deviation over a specified sample size. This MA acts as a baseline, and the standard deviation is used to measure how much the MA delta deviates from the mean.
Delta Normalization:
The MA delta, lower filter, and upper filter are normalized using a function that scales them to a specific range, typically from -100 to 100. Normalization helps in comparing these values on a consistent scale and enhances their visual representation.
Visual Representation:
The indicator visualizes the results through histograms and channels:
- The histogram bars represent the normalized MA delta. Red bars indicate negative and below-lower-filter values, green bars indicate positive and above-upper-filter values, and silver bars indicate values within the normal range.
- It also displays a Z-score channel, which represents the upper and lower filters after normalization. This channel helps traders identify price levels that are statistically significant and potentially indicative of market volatility.
In summary, the "MA Delta Volatility (Statistical Anomaly Detector)" indicator aims to help traders identify abnormal price movements in the market by analyzing the difference between two moving averages and applying statistical measures. It can be a valuable tool for traders looking to spot potential opportunities during periods of increased volatility or to identify potential market anomalies.
發行說明
Code refactor發行說明
Enhanced the robustness of the normalization function.發行說明
Incorporated an indicator description as comments within the code to provide better context and understanding發行說明
refactor: upgrade to v6, modularize with types and methods, improve normalization and configuration structure:- Pine Script version upgrade
- Modular structure (Settings, Results)
- Clearer configuration inputs
- Improved normalization logic via calcNormalized method
開源腳本
本著TradingView的真正精神,此腳本的創建者將其開源,以便交易者可以查看和驗證其功能。向作者致敬!雖然您可以免費使用它,但請記住,重新發佈程式碼必須遵守我們的網站規則。
免責聲明
這些資訊和出版物並不意味著也不構成TradingView提供或認可的金融、投資、交易或其他類型的意見或建議。請在使用條款閱讀更多資訊。
開源腳本
本著TradingView的真正精神,此腳本的創建者將其開源,以便交易者可以查看和驗證其功能。向作者致敬!雖然您可以免費使用它,但請記住,重新發佈程式碼必須遵守我們的網站規則。
免責聲明
這些資訊和出版物並不意味著也不構成TradingView提供或認可的金融、投資、交易或其他類型的意見或建議。請在使用條款閱讀更多資訊。