OPEN-SOURCE SCRIPT
已更新 Noldo CFTC COT Forex Indicator
Hello.
I decided to publish the COT Forex Indicator, which I created for convenience, as an open source.
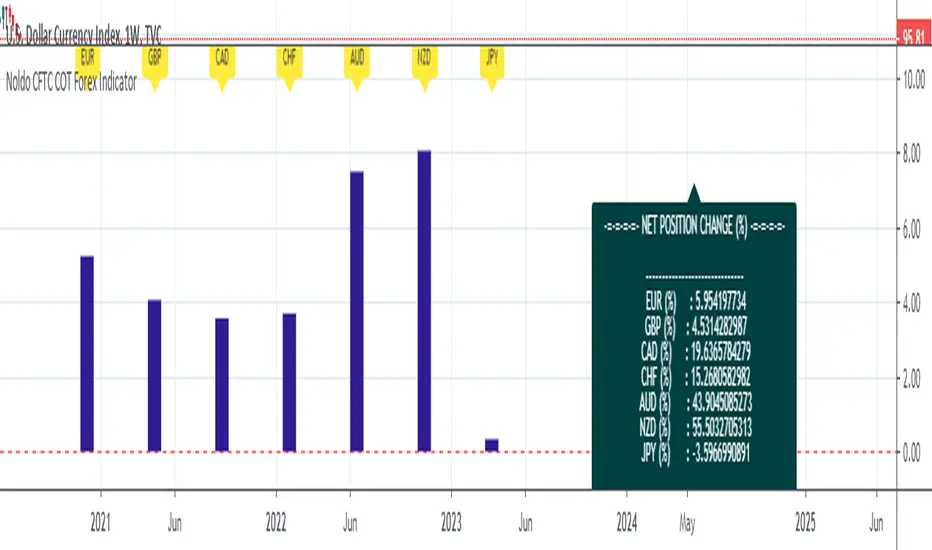
The period DXY is determined by the differences between the two signals on the Pivot Reversal Strategy on the weekly chart.(1W)
Thus, relative period point search is automated.

When the new signal comes, after the closing, the number of bars between the previous bar before the new signal comes both directions.
This elapsed time is our period in which we will look back on relative changes.
If there is no signal, the period remains constant, thereby allowing us to notice excessive changes.
And in this period, COT data exchange and price changes are reflected in the terminal.
The automatic time-keeping of the period and the automatic generation of the relative differences of the terminals according to the period prevents a great loss of time.
Thus, we create one of the strong columns that enable us to make decisions.
The other column is the signals we obtained as a result of technical analysis.
The last column is the economic agenda and data tracking.
That's why I made my decision to share this:
Real life should not be distracted,
should not be drowned in the sea of technical analysis.
COT data is one of the most important and valuable tools that bring us signs of real life,
It should not be forgotten !
A lot of time is lost while doing these analyzes, and I wanted this to be much more practical and tidy!
And we can see if there are factors that will back up our incoming signals.
Usage
General kind request:
Authors who know the technical broad expression of the security function or have an idea about its creation, please reach me.
Best regards.
I decided to publish the COT Forex Indicator, which I created for convenience, as an open source.
The period DXY is determined by the differences between the two signals on the Pivot Reversal Strategy on the weekly chart.(1W)
Thus, relative period point search is automated.
When the new signal comes, after the closing, the number of bars between the previous bar before the new signal comes both directions.
This elapsed time is our period in which we will look back on relative changes.
If there is no signal, the period remains constant, thereby allowing us to notice excessive changes.
And in this period, COT data exchange and price changes are reflected in the terminal.
The automatic time-keeping of the period and the automatic generation of the relative differences of the terminals according to the period prevents a great loss of time.
Thus, we create one of the strong columns that enable us to make decisions.
The other column is the signals we obtained as a result of technical analysis.
The last column is the economic agenda and data tracking.
That's why I made my decision to share this:
Real life should not be distracted,
should not be drowned in the sea of technical analysis.
COT data is one of the most important and valuable tools that bring us signs of real life,
It should not be forgotten !
A lot of time is lost while doing these analyzes, and I wanted this to be much more practical and tidy!
And we can see if there are factors that will back up our incoming signals.
Usage
- This script works only on DXY.
You must open DXY.
- It only works on 1W graphics.
Because COT data is announced on Tuesday, it will cause repaint every Tuesday.
However, since it is a terminal, this factor is not strong enough to affect your decisions.
For use, you should open the bottom panel, go a little to the right in the history section and enlarge the panel you have opened.
The terminal will take its form in the presentation and provide analysis on the big screen.
- COT data are pulled via Quandl.
General kind request:
Authors who know the technical broad expression of the security function or have an idea about its creation, please reach me.
Best regards.
發行說明
Open Interest code bug fixed.開源腳本
秉持TradingView一貫精神,這個腳本的創作者將其設為開源,以便交易者檢視並驗證其功能。向作者致敬!您可以免費使用此腳本,但請注意,重新發佈代碼需遵守我們的社群規範。
免責聲明
這些資訊和出版物並非旨在提供,也不構成TradingView提供或認可的任何形式的財務、投資、交易或其他類型的建議或推薦。請閱讀使用條款以了解更多資訊。
免責聲明
這些資訊和出版物並非旨在提供,也不構成TradingView提供或認可的任何形式的財務、投資、交易或其他類型的建議或推薦。請閱讀使用條款以了解更多資訊。