OPEN-SOURCE SCRIPT
Price strength around MA
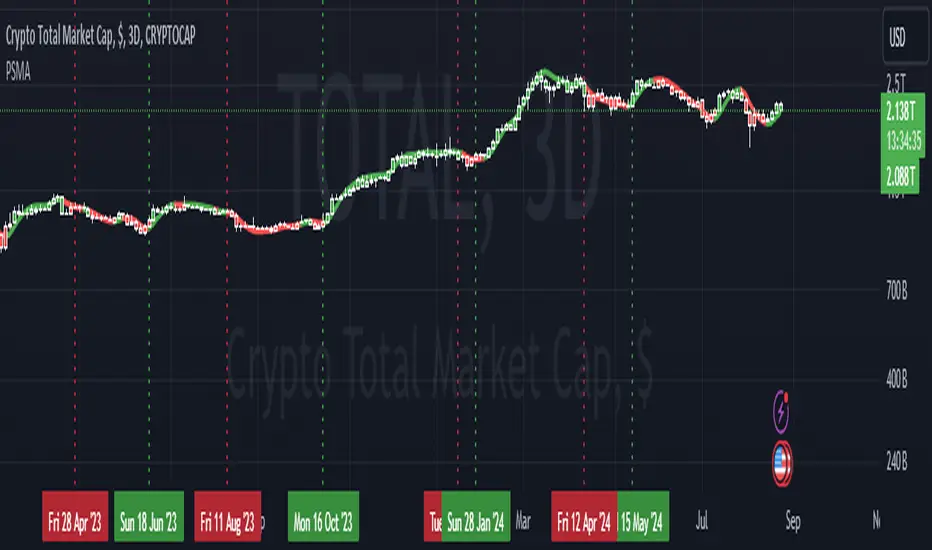
This indicatorit takes the HMA and calculates the difference between close and HMA. Within a lookback period it adds all values together where price is above/below the HMA. However, it squares the values before adding them together, so that larger differences have a bigger impact (this is to detect breakouts). After that it subtracts all the negative values from the positive ones so that in the end we have one single number that represents price behavior in the lookback period. This number is then added to the difference between an EMA and a SMA to produce the final signal of this indicator.
開源腳本
In true TradingView spirit, the creator of this script has made it open-source, so that traders can review and verify its functionality. Kudos to the author! While you can use it for free, remember that republishing the code is subject to our House Rules.
免責聲明
The information and publications are not meant to be, and do not constitute, financial, investment, trading, or other types of advice or recommendations supplied or endorsed by TradingView. Read more in the Terms of Use.