PROTECTED SOURCE SCRIPT
Yield Curve Analyzer - Market Radar
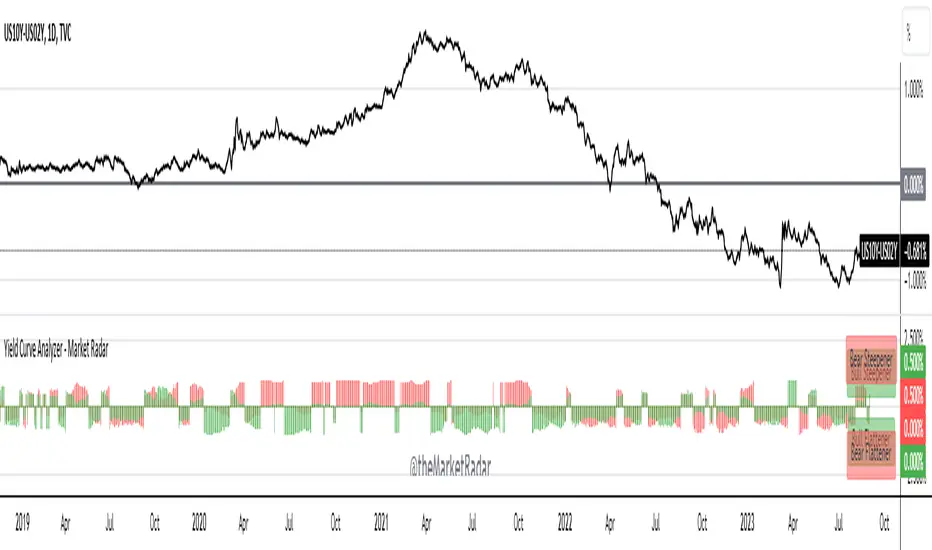
This is a script that gives insight into the types of moves that are happening across the yield curve. It helps in identifying both bull/bear steepeners and flatteners between two tenors.
The indicator displays data as a percentage of the steepeners and flatteners that have occurred over a short-term trailing window. This gives a reading that is more digestible with less noise.
Currently, the indicator only displays data for the 10Y-2Y US Treasury yield spread.
We intend to add additional spreads in the near future; such as 10Y-3M, 30Y-5Y, and 30Y-2Y.
受保護腳本
此腳本以閉源形式發佈。 不過,您可以自由使用,沒有任何限制 — 點擊此處了解更多。
免責聲明
這些資訊和出版物並非旨在提供,也不構成TradingView提供或認可的任何形式的財務、投資、交易或其他類型的建議或推薦。請閱讀使用條款以了解更多資訊。
受保護腳本
此腳本以閉源形式發佈。 不過,您可以自由使用,沒有任何限制 — 點擊此處了解更多。
免責聲明
這些資訊和出版物並非旨在提供,也不構成TradingView提供或認可的任何形式的財務、投資、交易或其他類型的建議或推薦。請閱讀使用條款以了解更多資訊。