RicardoSantos

[RS]Multiple Moving Averages System V3

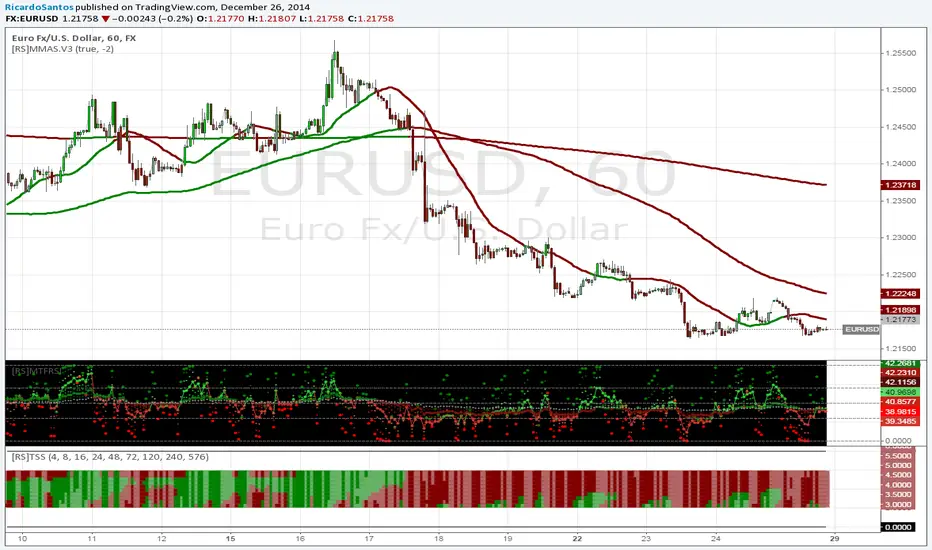
Multiple moving averages system with color coding and hardcoded lengths based on time frame, if you have any suggestions feel free to post or pm.
開源腳本

本著真正的TradingView精神,該腳本的作者將其開源發布,以便交易者可以理解和驗證它。為作者喝彩吧!您可以免費使用它,但在出版物中重複使用此代碼受網站規則的約束。 您可以收藏它以在圖表上使用。

免責聲明

這些資訊和出版物並不意味著也不構成TradingView提供或認可的金融、投資、交易或其他類型的意見或建議。請在使用條款閱讀更多資訊。

想在圖表上使用此腳本?
study(title="[RS]Multiple Moving Averages System V3", shorttitle="[RS]MMAS.V3", overlay=true)
useDPO = input(true)
src = ohlc4

ma_length00 = period == "1" ? 15 : 
        period == "5" ? 24 : // 2 hours
        period == "15" ? 12 : 
        period == "30" ? 8 : 
        period == "45" ? 8 : 
        period == "60" ? 24 : 
        period == "120" ? 12 : 
        period == "240" ? 6 : 
        period == "D" ? 5 : 
        period == "W" ? 4 : 
        period == "M" ? 6 : 13

ma_length01 = period == "1" ? 60 : 
        period == "5" ? 288 : // 1 day
        period == "15" ? 48 : 
        period == "30" ? 48 : 
        period == "45" ? 32 : 
        period == "60" ? 120 : 
        period == "120" ? 58 : 
        period == "240" ? 30 : 
        period == "D" ? 20 : 
        period == "W" ? 12 : 
        period == "M" ? 24 : 34

ma_length02 = period == "1" ? 1440 : 
        period == "5" ? 1440 : // 1 week
        period == "15" ? 480 : 
        period == "30" ? 240 : 
        period == "45" ? 160 : 
        period == "60" ? 576 : // 1 month
        period == "120" ? 240 : 
        period == "240" ? 120 : 
        period == "D" ? 60 : 
        period == "W" ? 52 : 
        period == "M" ? 60 : 144


ema1 = sma(src, ma_length00)
ema2 = sma(src, ma_length01)
ema3 = sma(src, ma_length02)

// ma color system:
c(ma) => ma < close ? green : maroon

p1 = plot(ema1, color=c(ema1), linewidth=3, title="ma1")
p2 = plot(ema2, color=c(ema2), linewidth=3, title="ma2")
p3 = plot(ema3, color=c(ema3), linewidth=3, title="ma3")

// ||------------------------------------------||
// ||---    DPO Weighted MA & Bar Colors    ---||
// ||------------------------------------------||

// DPO
dpo_weight = input(0.125)
dpo_length = round(1 + ma_length00 / 10)
dpo_src = ohlc4

dpo_disp = (dpo_src - sma(dpo_src[round(dpo_length/2) + 1], dpo_length))
dpo = (dpo_src - sma(dpo_src, dpo_length))

dpo_f = (dpo / dpo_src) * 1
dpo_df = (dpo_disp / dpo_src) * 1

dpo_trend = dpo_df - dpo_f
dpo_cycle = dpo_trend + dpo_df

dpo_diff = dpo_cycle-dpo_trend

// ma
ma1 = sma(dpo_src, dpo_length)
ma2 = sma(ma1 + (ma1 * (dpo_diff-dpo_trend))*dpo_weight, 6) 

bgsrc = useDPO ? dpo_src : sma(src, dpo_length)
plot(bgsrc, color=silver, linewidth=1)

bc = bgsrc > ma2 and ema1 < ohlc4 ?
        close > open ? lime : green :
        bgsrc < ma2 and ema1 > ohlc4 ?
        close > open ? red : maroon :
        close > open ? silver : gray

barcolor(bc)