OPEN-SOURCE SCRIPT
ka66: Externally-Sourced MACD
This indicator generalises the idea of MACD to take any arbitrary series available on the chart, using input.source values.
To provide an overview of the MACD indicator:
With this indicator, you can analyse momentum between any 2 series (not just EMAs), they could be raw close prices, other moving averages on the chart including specialised ones, that most MACD implementations won't provide a facility for, for example Kaufman Moving Average.
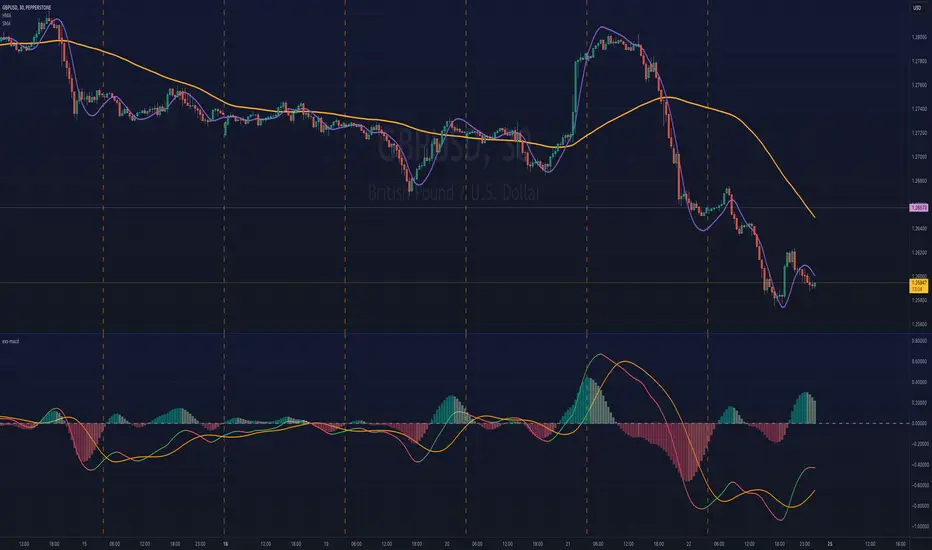
The chart shows this indicator sourcing 2 inputs from the chart:
It then calculates the MACD (Series1 - Series2), and a Signal line from the resulting MACD.
A signal series is still calculated manually by the indicator, and thus will be restricted to the provided moving average options (this indicator provides a few like EMA, SMA, Hull, and so on).
Uses of this indicator are essentially what you will use a MACD for:
To provide an overview of the MACD indicator:
- You have two EMAs, one with a faster period, usually 12, another with a slower period, usually 26.
- You calculate a MACD line, by doing (fastEMA - slowEMA)
- You then calculate a Signal Line by taking a moving average of the MACD line over some period.
With this indicator, you can analyse momentum between any 2 series (not just EMAs), they could be raw close prices, other moving averages on the chart including specialised ones, that most MACD implementations won't provide a facility for, for example Kaufman Moving Average.
The chart shows this indicator sourcing 2 inputs from the chart:
- A Hull Moving Average as the fast series
- And a Simple Moving Average as the slow series
It then calculates the MACD (Series1 - Series2), and a Signal line from the resulting MACD.
A signal series is still calculated manually by the indicator, and thus will be restricted to the provided moving average options (this indicator provides a few like EMA, SMA, Hull, and so on).
Uses of this indicator are essentially what you will use a MACD for:
- Evaluate momentum of a strength.
- Crossover Signals: MACD vs. Signal, MACD vs. Zero Line, MACD Histogram gradation.
- Evaluate overbought/oversold conditions.
- As a low-resolution view to confirm price action.
- Divergences
開源腳本
秉持TradingView一貫精神,這個腳本的創作者將其設為開源,以便交易者檢視並驗證其功能。向作者致敬!您可以免費使用此腳本,但請注意,重新發佈代碼需遵守我們的社群規範。
免責聲明
這些資訊和出版物並非旨在提供,也不構成TradingView提供或認可的任何形式的財務、投資、交易或其他類型的建議或推薦。請閱讀使用條款以了解更多資訊。
免責聲明
這些資訊和出版物並非旨在提供,也不構成TradingView提供或認可的任何形式的財務、投資、交易或其他類型的建議或推薦。請閱讀使用條款以了解更多資訊。