OPEN-SOURCE SCRIPT
Auto Pivots with S/R Levels
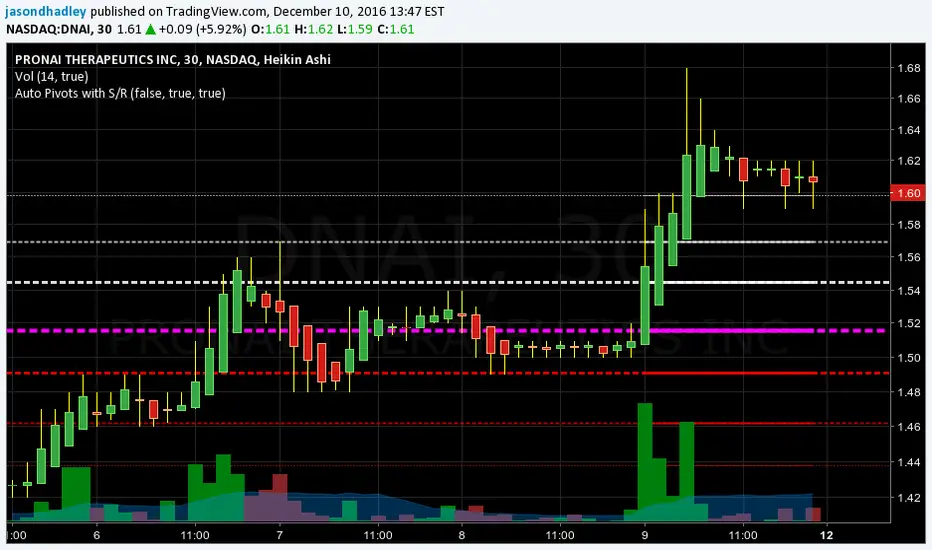
Plots out the pivot point with corresponding Support / Resistance levels.
It will automatically determine the time frame to calculate pivots based on the current view resolution.
Monthly resolution will pull a yearly pivot
Weekly resolution will pull a monthly pivot
Daily view will pull a weekly pivot
Intraday view will pull a daily pivot.
You have the choice of using Standard pivots or Fibonacci pivots
You can choose to only display the most recent pivot or all pivots
You can chose to extend the most recent pivot across the whole chart as a price line
TODO:
- Add in the ability to choose how far back historically to display pivots
- Add in calculations for smaller resolutions to calculate off lower time frames. EX: minute resolution should pull hour time frame to calculate pivots.
開源腳本
秉持TradingView一貫精神,這個腳本的創作者將其設為開源,以便交易者檢視並驗證其功能。向作者致敬!您可以免費使用此腳本,但請注意,重新發佈代碼需遵守我們的社群規範。
免責聲明
這些資訊和出版物並非旨在提供,也不構成TradingView提供或認可的任何形式的財務、投資、交易或其他類型的建議或推薦。請閱讀使用條款以了解更多資訊。
開源腳本
秉持TradingView一貫精神,這個腳本的創作者將其設為開源,以便交易者檢視並驗證其功能。向作者致敬!您可以免費使用此腳本,但請注意,重新發佈代碼需遵守我們的社群規範。
免責聲明
這些資訊和出版物並非旨在提供,也不構成TradingView提供或認可的任何形式的財務、投資、交易或其他類型的建議或推薦。請閱讀使用條款以了解更多資訊。