OPEN-SOURCE SCRIPT
已更新 High Volume Price Levels x3
This script detects recent huge volume areas to help you finding out good support and resistance levels.
For each of the3 periods (defaults : 100, 200, 500) a new line will be drawn from the last time the volume amount exceeded n% (default 99%) of the highest volume on the same period, to the next occurence.
Most of time, these lines represent strong support and resistance levels which can be helpful in your technical analysis.
Options:
Notes:
* Sometimes, the last detected level from every periods can be the same at the same moment. In this situation, you'll only see one or two of the lines instead of three.
* I'd like to figure out how to continuously draw every interesting levels without making the chart unreadable. Of course this script will be updated if I find a good way to do it.
* Feel free to suggest any improvements/modifications.
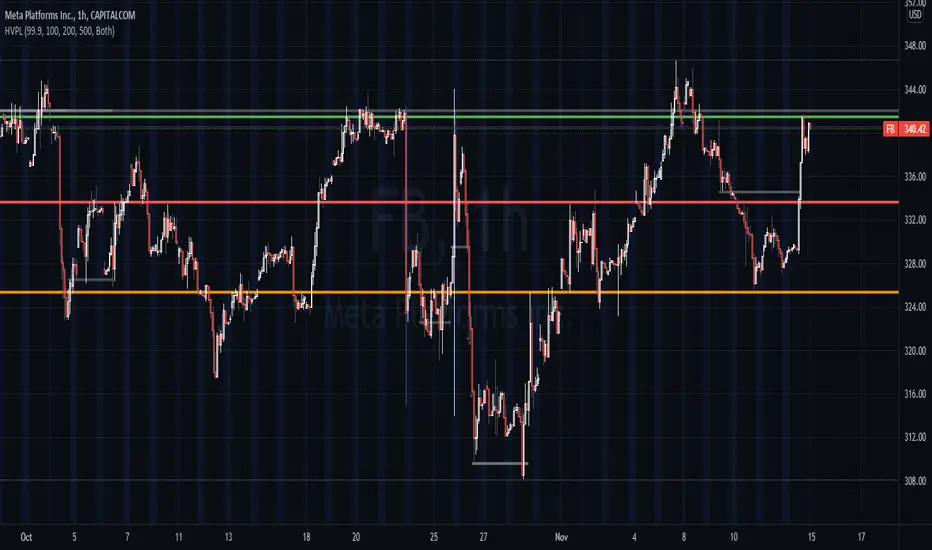
Example:

For each of the3 periods (defaults : 100, 200, 500) a new line will be drawn from the last time the volume amount exceeded n% (default 99%) of the highest volume on the same period, to the next occurence.
Most of time, these lines represent strong support and resistance levels which can be helpful in your technical analysis.
Options:
- Volume trigger level: represents the minimum % of the highest volume within the given period on which you want to draw a new price level. (But higher this % is, stronger the levels will be)
- Periods: The reference periods for high volume detection.
- Show period: Enable/Disable the use of any period.
- Period Color: Select a color correspondig to each period.
- Show current levels only: Disable drawing of previous levels, to display current levels only.
- Extend last level: Extend current lines to right/left/both or none sides of your chart.
Notes:
* Sometimes, the last detected level from every periods can be the same at the same moment. In this situation, you'll only see one or two of the lines instead of three.
* I'd like to figure out how to continuously draw every interesting levels without making the chart unreadable. Of course this script will be updated if I find a good way to do it.
* Feel free to suggest any improvements/modifications.
Example:
發行說明
Demo chart updated. Previous levels drawn發行說明
- Corrected mistyped short title
- A "Ghost lines" option that extend 3rd period price lines has been added (activated by default)
- Previous levels are now colored in gray
發行說明
Fix wrong operator in the previous update 1min (ago)發行說明
fix: old lines corresponding to 3rd price level still in red instead of gray when ghost lines are disabled發行說明
fix: tiny display bug for period1 linefix: removing useless empty lines
fix: any line width is now fixed to 3
開源腳本
秉持TradingView一貫精神,這個腳本的創作者將其設為開源,以便交易者檢視並驗證其功能。向作者致敬!您可以免費使用此腳本,但請注意,重新發佈代碼需遵守我們的社群規範。
免責聲明
這些資訊和出版物並非旨在提供,也不構成TradingView提供或認可的任何形式的財務、投資、交易或其他類型的建議或推薦。請閱讀使用條款以了解更多資訊。
免責聲明
這些資訊和出版物並非旨在提供,也不構成TradingView提供或認可的任何形式的財務、投資、交易或其他類型的建議或推薦。請閱讀使用條款以了解更多資訊。