OPEN-SOURCE SCRIPT
Multi Deviation VWAP [OmegaTools]
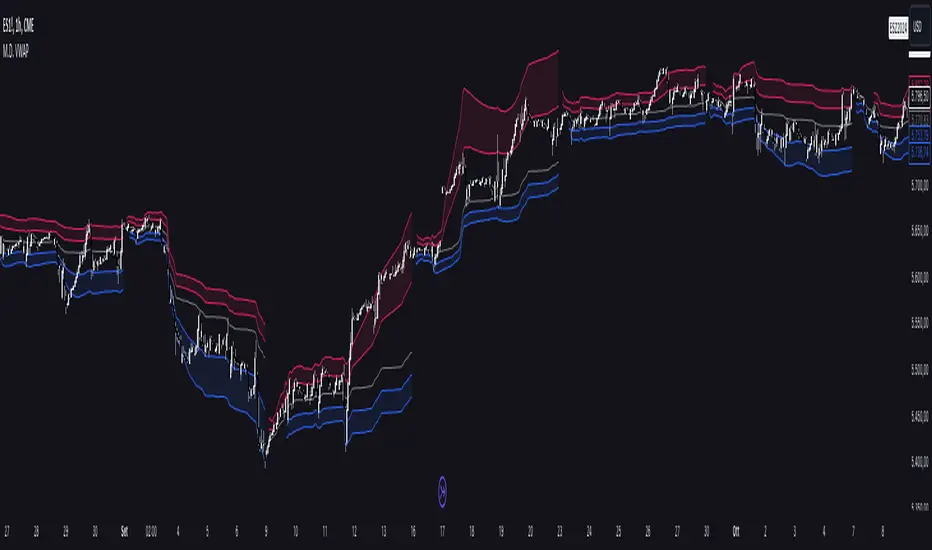
The Multi Deviation VWAP is an original variation of the traditional VWAP indicator, designed to enhance your trading experience by providing more precise market insights. While the conventional VWAP calculates a single price level based on volume and price over a given period, the Multi Deviation VWAP goes a step further by introducing dynamic upper and lower bands that adapt to market conditions. These bands give traders a more comprehensive understanding of volatility and price action, making it an ideal tool for various trading strategies, especially for identifying potential price reversals or trend continuations.
Key Features:
Separate Calculation of Deviation Bands:
Unlike traditional VWAP bands, where both the upper and lower bands are symmetrically calculated using a single deviation value, the Multi Deviation VWAP calculates the deviations independently for the upper and lower bands. This allows for a more accurate reflection of market dynamics.
The upper deviation band is based on the average distance of closing prices above the VWAP, while the lower deviation band considers the average distance of closing prices below the VWAP.
This separation provides a more tailored approach, adapting to whether the market is showing bullish or bearish momentum, as opposed to a fixed, equal deviation in both directions.
Internal and External Bands:
Two sets of deviation bands are plotted: Internal Bands and External Bands, controlled by user inputs (factorone for internal and factortwo for external). These bands offer multiple levels of support and resistance based on market volatility.
The Internal Bands are closer to the VWAP and act as the first level of support/resistance, suitable for short-term or tighter trading ranges.
The External Bands are further from the VWAP and capture more significant market swings, useful for identifying larger trends or setting wider stop-losses.
Timeframe Flexibility:
The indicator allows traders to select the desired timeframe (1D by default) over which the VWAP and its deviation bands are calculated. This flexibility enables users to adapt the indicator to different trading styles, from intraday scalping to longer-term trend analysis.
Visual Enhancements:
Bullish and Bearish Colors: The bands are color-coded for quick visual interpretation. Bullish bands (lower deviations) are colored blue, while bearish bands (upper deviations) are colored red, making it easy to differentiate between market conditions at a glance.
Plot Fill: The area between the internal and external bands is shaded, providing clear visual zones of potential price containment, aiding in understanding the market structure and anticipating price movements.
How It Differs from a Standard VWAP:
Traditional VWAP provides a single price line that represents the volume-weighted average price over a given period, often used to identify general price trends.
In contrast, the Multi Deviation VWAP introduces upper and lower bands calculated separately based on price deviations above and below the VWAP, giving a more nuanced view of market volatility.
Symmetrical bands in traditional VWAP may not always accurately reflect the market's true behavior, especially in trending markets, where upward and downward price movements aren't always equal. By splitting the deviation calculations, this tool provides a more dynamic and realistic view of price action, adapting to whether the market is showing stronger upward or downward pressure.
Use Cases:
Trend Identification: The VWAP line acts as a central trend line, while the deviation bands offer levels of potential support and resistance. When price moves beyond the external bands, it may indicate overextension and potential reversal.
Volatility Trading: Traders can use the internal and external bands to set dynamic take-profit or stop-loss levels, allowing for flexible risk management depending on market conditions.
Range Trading: In consolidating markets, the Multi Deviation VWAP can help traders identify optimal buy and sell zones as the price oscillates between the upper and lower bands.
By incorporating independent deviation bands, this indicator provides traders with a more responsive tool that reflects market behavior more accurately, helping them make informed trading decisions with enhanced precision.
開源腳本
秉持TradingView一貫精神,這個腳本的創作者將其設為開源,以便交易者檢視並驗證其功能。向作者致敬!您可以免費使用此腳本,但請注意,重新發佈代碼需遵守我們的社群規範。
免責聲明
這些資訊和出版物並非旨在提供,也不構成TradingView提供或認可的任何形式的財務、投資、交易或其他類型的建議或推薦。請閱讀使用條款以了解更多資訊。
開源腳本
秉持TradingView一貫精神,這個腳本的創作者將其設為開源,以便交易者檢視並驗證其功能。向作者致敬!您可以免費使用此腳本,但請注意,重新發佈代碼需遵守我們的社群規範。
免責聲明
這些資訊和出版物並非旨在提供,也不構成TradingView提供或認可的任何形式的財務、投資、交易或其他類型的建議或推薦。請閱讀使用條款以了解更多資訊。