PROTECTED SOURCE SCRIPT
Daily SMAs 10/20/50/100/200
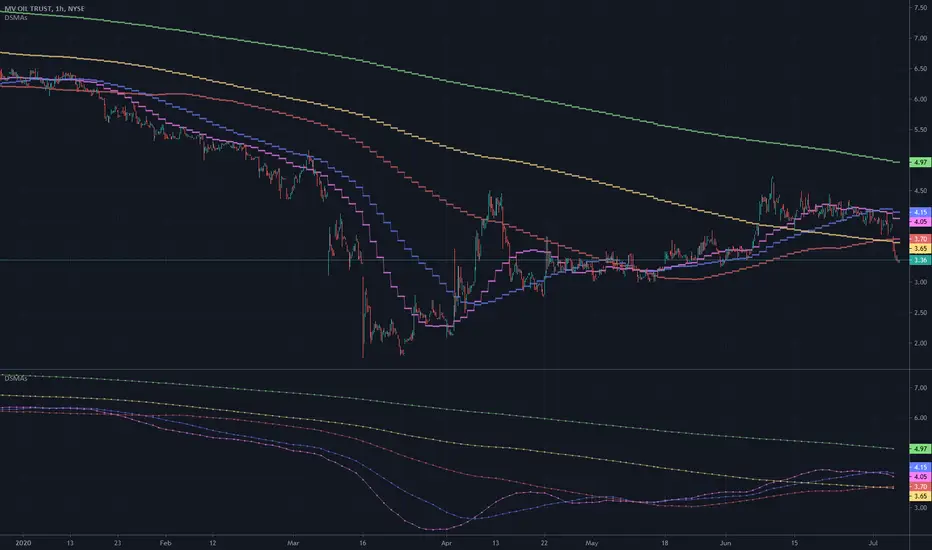
This is one of the oldest and simplest trading tools still utilized today, having an ancillary role with long term trading and analyst's commentary in media/news. It's a multicator employing PSv4.0, freely available to ALL, with numerous simple moving averages(SMAs) that use different historical periods of observation in their formulations to portray trading bias. I have revived this tool to my modern expectations of what it could be, embellished with the "Power of Pine".
I provided these moving averages in pastel colors with dotted step-lines as an attempt to not interfere with other "more important indicators" that may exist in your overlay pane. In "Settings" with the "Time Frame" input() set to "Daily", while inspecting much smaller time frames other than daily candles, you may use the sampling quantization tweak to smooth out those step-lines for a different visual appeal. This is exemplified in the lower indicator pane of the chart demonstration above. Also, the brightness control can be quickly and easily fine tuned to your personal preference of visibility that is not distracting. The moving averages are all independently adjustable if you require more responsive calculations with shorter periods of time, or longer...
Features List Includes:
"Daily" or "Chart" time frames
Brightness control
Line thickness adjustment
Sampling quantization tweak
Adjustable periods for the SMAs
The comments section below is solely just for commenting and other remarks, ideas, compliments, etc... regarding only this indicator, not others. When available time provides itself, I will consider your inquiries, thoughts, and concepts presented below in the comments section if you do have any questions or comments regarding this indicator. When my indicators achieve more prevalent use by TV members, I may implement more ideas when they present themselves as worthy additions. As always, "Like" it if you simply just like it with a proper thumbs up, and also return to my scripts list occasionally for additional postings. Have a profitable future everyone!
受保護腳本
此腳本以閉源形式發佈。 不過,您可以自由且不受任何限制地使用它 — 在此處了解更多資訊。
免責聲明
這些資訊和出版物並不意味著也不構成TradingView提供或認可的金融、投資、交易或其他類型的意見或建議。請在使用條款閱讀更多資訊。
受保護腳本
此腳本以閉源形式發佈。 不過,您可以自由且不受任何限制地使用它 — 在此處了解更多資訊。
免責聲明
這些資訊和出版物並不意味著也不構成TradingView提供或認可的金融、投資、交易或其他類型的意見或建議。請在使用條款閱讀更多資訊。