OPEN-SOURCE SCRIPT
ATRCD, Average True Range Convergence Divergence
ATRCD calculates a MACD over the Average True Range, therefore helping traders to spot momentum in volatility.
The Average True Range is a measurement of the average candle size over a period of time, i.e. when the candles are small, the ATR is low. ATR measures volatility.
The MACD is a momentum indicator. It measures market momentum based on the average closing prices over a period.
Therefore, using the MACD calculation over the ATR we get a measurement of momentum in volatility. The ATRCD is a concept at this point. I was curious to see whether such an indicator could provide any edge trading the markets. Because this is a MACD of the ATR the same concepts can be applied, e.g. spotting divergences, momentum trends, etc. Please be careful however, this indicator only looks like the MACD but it measures volatility and not price momentum. Maybe this can help traders confirm breakouts using price action?
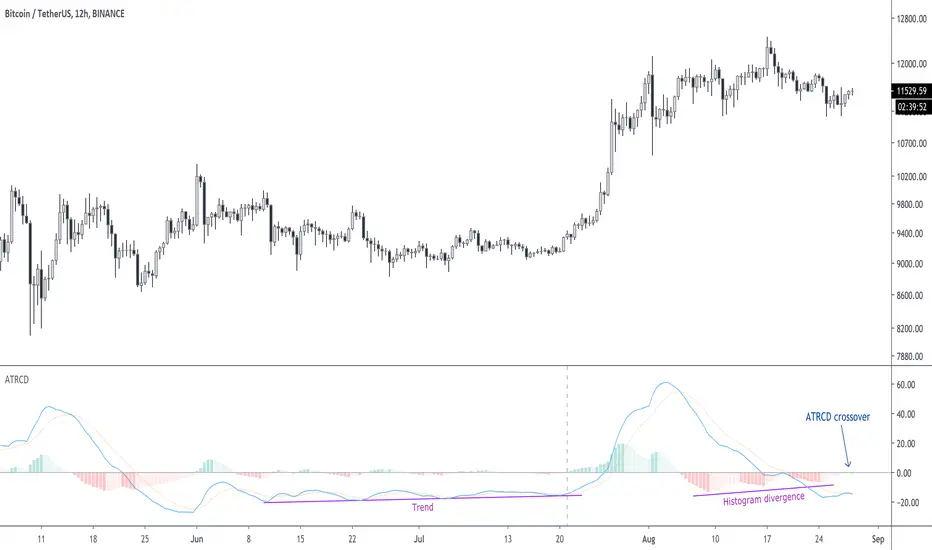
Applying this indicator to the 12h of BTC/USDT we can see that we could be nearing a volatility expansion with a divergence on the histogram, and an ATRCD crossover.


 BTCUSDT
The Average True Range is a measurement of the average candle size over a period of time, i.e. when the candles are small, the ATR is low. ATR measures volatility.
The MACD is a momentum indicator. It measures market momentum based on the average closing prices over a period.
Therefore, using the MACD calculation over the ATR we get a measurement of momentum in volatility. The ATRCD is a concept at this point. I was curious to see whether such an indicator could provide any edge trading the markets. Because this is a MACD of the ATR the same concepts can be applied, e.g. spotting divergences, momentum trends, etc. Please be careful however, this indicator only looks like the MACD but it measures volatility and not price momentum. Maybe this can help traders confirm breakouts using price action?
Applying this indicator to the 12h of BTC/USDT we can see that we could be nearing a volatility expansion with a divergence on the histogram, and an ATRCD crossover.
開源腳本
本著TradingView的真正精神,此腳本的創建者將其開源,以便交易者可以查看和驗證其功能。向作者致敬!雖然您可以免費使用它,但請記住,重新發佈程式碼必須遵守我們的網站規則。
免責聲明
這些資訊和出版物並不意味著也不構成TradingView提供或認可的金融、投資、交易或其他類型的意見或建議。請在使用條款閱讀更多資訊。
免責聲明
這些資訊和出版物並不意味著也不構成TradingView提供或認可的金融、投資、交易或其他類型的意見或建議。請在使用條款閱讀更多資訊。