JustUncleL

Bollinger Band and ADX Retrace Alert v0.1 by JustUncleL

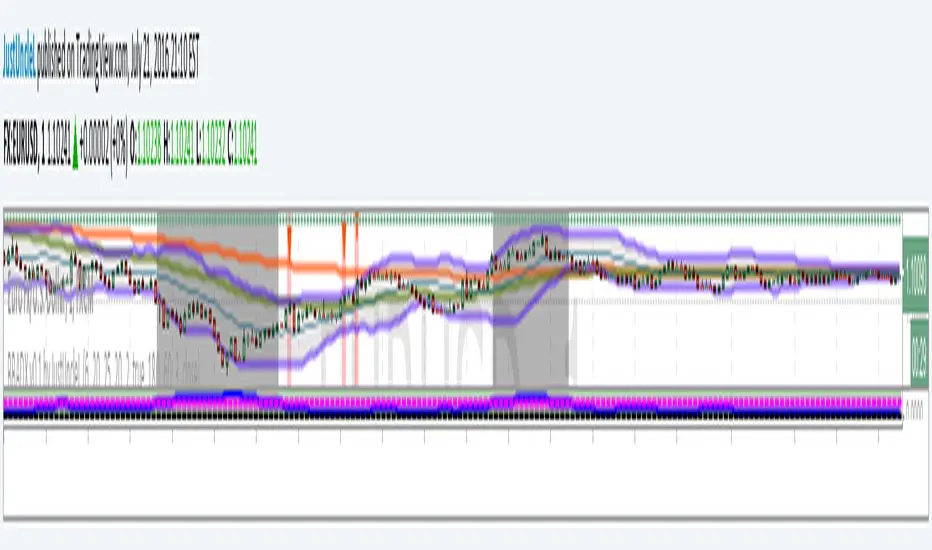
This script is an implementation of a well known Bollinger band + ADX retracement strategy for 1min to 15min charts. This variation uses my own settings, a market direction filter and has an alert that can be added to your trading alarms.

JustUncleL
開源腳本

本著真正的TradingView精神,該腳本的作者將其開源發布,以便交易者可以理解和驗證它。為作者喝彩吧!您可以免費使用它,但在出版物中重複使用此代碼受網站規則的約束。 您可以收藏它以在圖表上使用。

免責聲明

這些資訊和出版物並不意味著也不構成TradingView提供或認可的金融、投資、交易或其他類型的意見或建議。請在使用條款閱讀更多資訊。

想在圖表上使用此腳本?
//@version=2
//
// Title: "Bollinger Band and ADX Retrace Alert v0.1 by JustUncleL".
// Author: JustUncleL
// Date:   22-Jul-2016
// Version: 0.1
//
// * Description *
//   Brief: This strategy follows variation of a well known Bollinger band + ADX reversal 
//          strategy. Includes warning alert conditions. Can be used 1min to 15min charts.
//
//
//   Full:  Bollinger is standard calculated from SMA (20,2).
//          The strategy is we wait for a candle that breaks and closes outside
//          the Bollinger Bands and then filter on ADX and market direction: if
//          the ADX(6,20) is below level 25 and optional market direction filter applied.
//          Market direction (as indicated by 180/60 EMAs) needs to in the opposite
//          direction  to breaking candle. We place the binary trade on the 
//          following candle in opposite direction of breaking candle.
//          Martingale can be used, but only at most 2 levels, otherwise count trade as 
//          a loss, I use 10,25,60 or 10,30,90 Martingales.
//
//          Breakout identified by shapes:
//          The red or green hightlighted diamonds will normally pre-warn alert
//          for PUT/CALL to place trade on the NEXT candle after alert confirmed
//          on close of break candle.
//          If using 1min charts then place 60sec or 120sec binary trade.
//
//          Trade wisely, 1min candle trading can be fun, but also risky. Try
//          in Demo first. Only perform 5 trades a session. This strategy does not 
//          genrate many alerts, particularly with market direction filter, but they
//          are normally pretty good.
//
//
// * Version Changes *
//   0.1 : Original Version.
//
// * Reference *
//   This code use Bollinger calc by JayRogers in "[JR] Multi Bollinger Heat Bands - EMA/Break options"
//   Also uses ADX/DMI calc from "Directional Movement (DMI) by Greeny" (also found in other scripts)
//   http://www.binaryoptionstrategy.eu/36-binary-options-strategy-with-bollinger-bands-and-adx-indicator/
//   http://forums.binaryoptionsthatsuck.com/threads/12720-Bollinger-Bands-and-ADX-with-120-sec-expiry
//   http://forums.binaryoptionsthatsuck.com/threads/11973-The-Mysteries-of-the-Unnamed-Strategy
//
study("Bollinger Band and ADX Retrace Alert v0.1 by JustUncleL", shorttitle="BBADX v0.1 by JustUncleL", overlay=true, scale=scale.right)
//
// Collect all the settings, can be changed
adxlen = input(6, title="ADX Smoothing")
dilen = input(20, title="DI Length")
level1 = input(25,title="ADX Upper Level")
bb_length = input(20, minval=1, title="Bollinger Length")
bb_mult = input(2, title="Bollinger Multiplier", minval=0.5, maxval=10)
mFilter   = input(true,title="Use MA Direction Filter")
SlowMALen = input(180, minval=2, title="Slow Moving Average Length")
FastMALen = input(60, minval=1, title="Fast Moving Average Length")
dCandles  = input(3, minval=2, title="Candles to test Market Direction")
src = input(close, title="Source")

// Calculate moving averages
SlowEMA = ema(close, SlowMALen)
FastEMA = ema(close, FastMALen)
// Work out market direction from moving averages
direction = rising(SlowEMA,dCandles) and FastEMA>SlowEMA ? +1 : falling(SlowEMA,dCandles) and FastEMA<SlowEMA ? -1 : 0

//
// Draw the moving average lines
plot(SlowEMA, title="SlowEMA", style=line, linewidth=2, color=red)
plot(FastEMA, title="FastEMA", style=line, linewidth=2, color=olive)

//
// Calculate Bollinger Bands Deviation
bb_basis = sma(src, bb_length)
dev = stdev(src, bb_length)
bb_dev = bb_mult * dev
// Upper band
bb_high = bb_basis + bb_dev
// Lower Band
bb_low = bb_basis - bb_dev
// draw the Bollinger Bands
bb1=plot(bb_high, title="BB High", color=blue, transp=50, linewidth=2) 
bb2=plot(bb_low, title="BB Low", color=blue, transp=50, linewidth=2)
plot(bb_basis, title="BB Basis", color=teal, transp=50, linewidth=1)
fill(bb1,bb2, title="BB Fill", color=gray, transp=80)

// Calculate ADX
dirmov(len) =>
	up = change(high)
	down = -change(low)
	truerange = rma(tr, len)
	plus = fixnan(100 * rma(up > down and up > 0 ? up : 0, len) / truerange)
	minus = fixnan(100 * rma(down > up and down > 0 ? down : 0, len) / truerange)
	[plus, minus]

adx(dilen, adxlen) => 
	[plus, minus] = dirmov(dilen)
	sum = plus + minus
	adx = 100 * rma(abs(plus - minus) / (sum == 0 ? 1 : sum), adxlen)
	[adx, plus, minus]

[sig, up, down] = adx(dilen, adxlen)

// Check for break out alert
breakBBup  = na(breakBBup[1]) ? src>bb_high and close>open and sig<=level1 and (not mFilter or direction<0)
  : not breakBBup[1] and src>bb_high and close>open and sig<=level1 and (not mFilter or direction<0)
breakBBdn  = na(breakBBdn[1]) ? src<bb_low and close<open and sig<=level1 and (not mFilter or direction>0)
  : not breakBBdn[1] and src<bb_low and close<open and sig<=level1 and (not mFilter or direction>0)

// plot and highlight any breakouts
plotshape(breakBBup, title="BBADX down Arrow", style=shape.triangledown,location=location.abovebar, color=red, transp=0, size=size.tiny)
plotshape(breakBBdn,  title="BBADX up Arrow", style=shape.triangleup,location=location.belowbar, color=green, transp=0, size=size.tiny)
// draw background bar to highlight
breakColor = breakBBdn  ?  green : breakBBup ? red : na 
bgcolor(breakColor, transp=75)
// highlight the no-trade zones
adxbgColor = sig>level1 ? black : na
bgcolor(adxbgColor,transp=70)

// Generate alert condition when approaching, so can be watch to make entry decision manually.
alertcondition( breakBBup or breakBBdn, title="BBADX Alert", message="BBADX Trade Alert")

// EOF