INVITE-ONLY SCRIPT
已更新 MM Matrix Oscillator
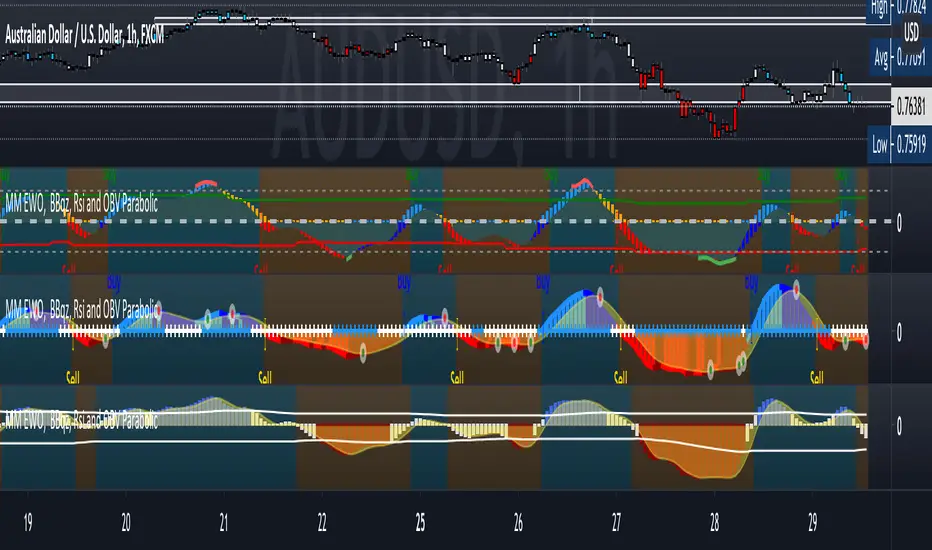
Here I present MM Matrix Oscillator
What the oscillator and histogram represent are trend candles, when the histogram is painted lime above 0 line it is buy, you will also see the buy signal below with an arrow, when the oscillator is painted red below the 0 line you will see the signal in red sell.
Dynamic Support and resistance to see possible exit points and extra confirmation on zones
You have an additional, exit buy and exit sell to perform scalping.
It has buy and sell signals alarm and also the painting of candles on the chart to see the trend. green=uptrend/red= downtrend
added "color trend and exit" in settings
red=downtrend
white=ranging
green=buy
Use link below or PM us for access you this indicator Happy Trading
發行說明
you can now select between Matrix
BBsquuze
and EWO all in one indicator
all of them can set buy/sell alerts.
僅限邀請腳本
只有經作者授權的使用者才能訪問此腳本,且通常需付費。您可以將此腳本加入收藏,但需先向作者申請並獲得許可後才能使用 — 點擊此處了解更多。如需更多詳情,請依照作者說明或直接聯繫MoneyMovesInvestments。
除非您完全信任其作者並了解腳本的工作原理,否則TradingView不建議您付費或使用腳本。您也可以在我們的社群腳本中找到免費的開源替代方案。
作者的說明
提醒:在請求訪問權限之前,請閱讀僅限邀請腳本指南。
免責聲明
這些資訊和出版物並不意味著也不構成TradingView提供或認可的金融、投資、交易或其他類型的意見或建議。請在使用條款閱讀更多資訊。
僅限邀請腳本
只有經作者授權的使用者才能訪問此腳本,且通常需付費。您可以將此腳本加入收藏,但需先向作者申請並獲得許可後才能使用 — 點擊此處了解更多。如需更多詳情,請依照作者說明或直接聯繫MoneyMovesInvestments。
除非您完全信任其作者並了解腳本的工作原理,否則TradingView不建議您付費或使用腳本。您也可以在我們的社群腳本中找到免費的開源替代方案。
作者的說明
提醒:在請求訪問權限之前,請閱讀僅限邀請腳本指南。
免責聲明
這些資訊和出版物並不意味著也不構成TradingView提供或認可的金融、投資、交易或其他類型的意見或建議。請在使用條款閱讀更多資訊。