INVITE-ONLY SCRIPT
已更新 Core Dimension v1.1 [by TC]
Core Dimension is a powerful trading indicator that generates accurate signals for all instruments types, markets and time frames.
The algorithm´s script is based on a trend-following momentum formula for precise prediction of price direction, and has the ability to efficiently eliminate irrelevant noise. The applied filter method reduces the impact of random price fluctuations and helps in identifying changes in market trends.
Traders can use the indicator for various trading approaches, including Long-, Short-, Scalping-, and Swing trading strategies:

Settings
The default settings work well for most instruments, but it's strongly recommended to adjust the settings to increase signal accuracy. It's important to note that the default settings have a bias towards upward momentum.
You can try our custom settings or tweak the parameters to suit your desired level of noise tolerance:
Factor - the "Factor" parameter is a constant in the calculation of the volatility smoothing filter and can be fine-tuned to achieve optimal signals for the instrument being traded. Higher values usually result in smoother signals.
Period – the "Period" variable determines the length (number of periods used) in the calculation for the trend-following momentum technique and can be adjusted to optimize signal generation. Generally, higher values increase sensitivity to price movements, while lower values reduce sensitivity and generate fewer signals.
Adjustment – is a parameter in the formula that makes Core Dimension uniquely dynamic in generating accurate signals with minimal noise. Experimentation with the parameter values is recommended, with a starting range between 0.9993 and 0.9999.
We suggest trying these custom settings:
0 – 1 - 0.9999
0 – 2 - 0.9997
0 – 8 - 0.9997
0.02475 – 0 - 0.9998
0.025 – 9 - 0.9993
0.125 – 5 - 0.9995
0.225 – 0 - 0.9998
-0.00025 – 5 - 0.9997
-0.000025 – 3 - 0.9997
0.024975 – 2 - 0.9999
0.05 – 0 - 1
0 - 21 - 1.0017
0 – 2 - 0.9999
0.375 – 0 - 1.0002
0.425 – 1 - 0.9997
0.275 – 13 - 1
Additional functionality: To assist traders in making informed decisions, Core Dimension also features a confirmation filter. The Adaptive Trendline provides traders with a good visual overview of when to enter or exit a trade, and can be used in combination with other indicators to determine when to take profit and execute stop-loss.

How to Use the Indicator:
1. Install the indicator on any instrument and time frame of your choice, adjusting the settings as needed.
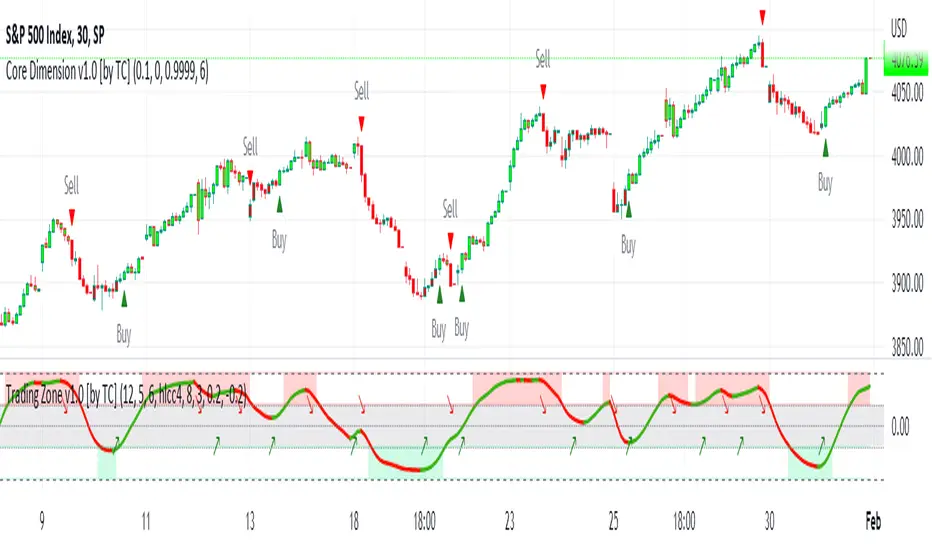
2. If a “Buy” signal is confirmed (represented by a green triangle, up ▲) –> this indicates an upward short-term trend and you may consider entering a Long position.
3. If a “Sell” signal is confirmed (represented by a red triangle, down ▼) –> this indicates a downward short-term trend and you may consider entering a Short position – (or exiting a Long position).
4. Exit the trade also –> when you have hit your desired profit target/limit or stop loss (determined by user).
IMPORTANT: Wait for candlestick close in order to ensure that the signal is confirmed!
Exactly how the Core Dimension indicator is used may vary among traders. When interpreted correctly, it allows traders to enter new trades in the direction of a developing trend or increasing momentum, and exit before the trend reverses. It can be used as a scalping tool in shorter time frames, or as a timing indicator for day trading or swing trading strategies.
The indicator has been developed to work with regular bar candles, but using it with Heikin Ashi candles is also recommended as it can help to filter out noise and capture high-quality trends.
⚠ If you are new to trading and/or technical analysis, it´s recommended to start with a demo account (paper-trading) until you become familiar with how to use the indicator.
Core Dimension is a non-repainting indicator, meaning that its signals stay constant even after the bar closes. When using the Alert function, we suggest to use the “Once Per Bar Close” configuration and wait until the bar has closed to confirm the entry or exit signal.
The algorithm´s script is based on a trend-following momentum formula for precise prediction of price direction, and has the ability to efficiently eliminate irrelevant noise. The applied filter method reduces the impact of random price fluctuations and helps in identifying changes in market trends.
Traders can use the indicator for various trading approaches, including Long-, Short-, Scalping-, and Swing trading strategies:
Settings
The default settings work well for most instruments, but it's strongly recommended to adjust the settings to increase signal accuracy. It's important to note that the default settings have a bias towards upward momentum.
You can try our custom settings or tweak the parameters to suit your desired level of noise tolerance:
Factor - the "Factor" parameter is a constant in the calculation of the volatility smoothing filter and can be fine-tuned to achieve optimal signals for the instrument being traded. Higher values usually result in smoother signals.
Period – the "Period" variable determines the length (number of periods used) in the calculation for the trend-following momentum technique and can be adjusted to optimize signal generation. Generally, higher values increase sensitivity to price movements, while lower values reduce sensitivity and generate fewer signals.
Adjustment – is a parameter in the formula that makes Core Dimension uniquely dynamic in generating accurate signals with minimal noise. Experimentation with the parameter values is recommended, with a starting range between 0.9993 and 0.9999.
We suggest trying these custom settings:
0 – 1 - 0.9999
0 – 2 - 0.9997
0 – 8 - 0.9997
0.02475 – 0 - 0.9998
0.025 – 9 - 0.9993
0.125 – 5 - 0.9995
0.225 – 0 - 0.9998
-0.00025 – 5 - 0.9997
-0.000025 – 3 - 0.9997
0.024975 – 2 - 0.9999
0.05 – 0 - 1
0 - 21 - 1.0017
0 – 2 - 0.9999
0.375 – 0 - 1.0002
0.425 – 1 - 0.9997
0.275 – 13 - 1
Additional functionality: To assist traders in making informed decisions, Core Dimension also features a confirmation filter. The Adaptive Trendline provides traders with a good visual overview of when to enter or exit a trade, and can be used in combination with other indicators to determine when to take profit and execute stop-loss.
How to Use the Indicator:
1. Install the indicator on any instrument and time frame of your choice, adjusting the settings as needed.
2. If a “Buy” signal is confirmed (represented by a green triangle, up ▲) –> this indicates an upward short-term trend and you may consider entering a Long position.
3. If a “Sell” signal is confirmed (represented by a red triangle, down ▼) –> this indicates a downward short-term trend and you may consider entering a Short position – (or exiting a Long position).
4. Exit the trade also –> when you have hit your desired profit target/limit or stop loss (determined by user).
IMPORTANT: Wait for candlestick close in order to ensure that the signal is confirmed!
Exactly how the Core Dimension indicator is used may vary among traders. When interpreted correctly, it allows traders to enter new trades in the direction of a developing trend or increasing momentum, and exit before the trend reverses. It can be used as a scalping tool in shorter time frames, or as a timing indicator for day trading or swing trading strategies.
The indicator has been developed to work with regular bar candles, but using it with Heikin Ashi candles is also recommended as it can help to filter out noise and capture high-quality trends.
⚠ If you are new to trading and/or technical analysis, it´s recommended to start with a demo account (paper-trading) until you become familiar with how to use the indicator.
Core Dimension is a non-repainting indicator, meaning that its signals stay constant even after the bar closes. When using the Alert function, we suggest to use the “Once Per Bar Close” configuration and wait until the bar has closed to confirm the entry or exit signal.
發行說明
Bug fix. Minor improvements to signal detection logic and script efficiency.發行說明
Minor script adjustment: Update to the Adaptive Trendline functionality.僅限邀請腳本
僅作者批准的使用者才能訪問此腳本。您需要申請並獲得使用許可,通常需在付款後才能取得。更多詳情,請依照作者以下的指示操作,或直接聯絡TradingCanyon。
請注意,此私人、僅限受邀使用者使用的腳本未經腳本審核員審核,其是否符合社群規範尚待確定。 TradingView不建議在未完全信任作者並了解其運作方式的情況下購買或使用腳本。您也可以在我們的社群腳本中找到免費的開源替代方案。
作者的說明
Access available here: https://www.tradingcanyon.com/
For any questions, contact TradingCanyon at email: info@tradingcanyon.com
免責聲明
這些資訊和出版物並非旨在提供,也不構成TradingView提供或認可的任何形式的財務、投資、交易或其他類型的建議或推薦。請閱讀使用條款以了解更多資訊。
僅限邀請腳本
僅作者批准的使用者才能訪問此腳本。您需要申請並獲得使用許可,通常需在付款後才能取得。更多詳情,請依照作者以下的指示操作,或直接聯絡TradingCanyon。
請注意,此私人、僅限受邀使用者使用的腳本未經腳本審核員審核,其是否符合社群規範尚待確定。 TradingView不建議在未完全信任作者並了解其運作方式的情況下購買或使用腳本。您也可以在我們的社群腳本中找到免費的開源替代方案。
作者的說明
Access available here: https://www.tradingcanyon.com/
For any questions, contact TradingCanyon at email: info@tradingcanyon.com
免責聲明
這些資訊和出版物並非旨在提供,也不構成TradingView提供或認可的任何形式的財務、投資、交易或其他類型的建議或推薦。請閱讀使用條款以了解更多資訊。