OPEN-SOURCE SCRIPT
BDC - Bitcoin (BTC) Dominance Change [Logue]
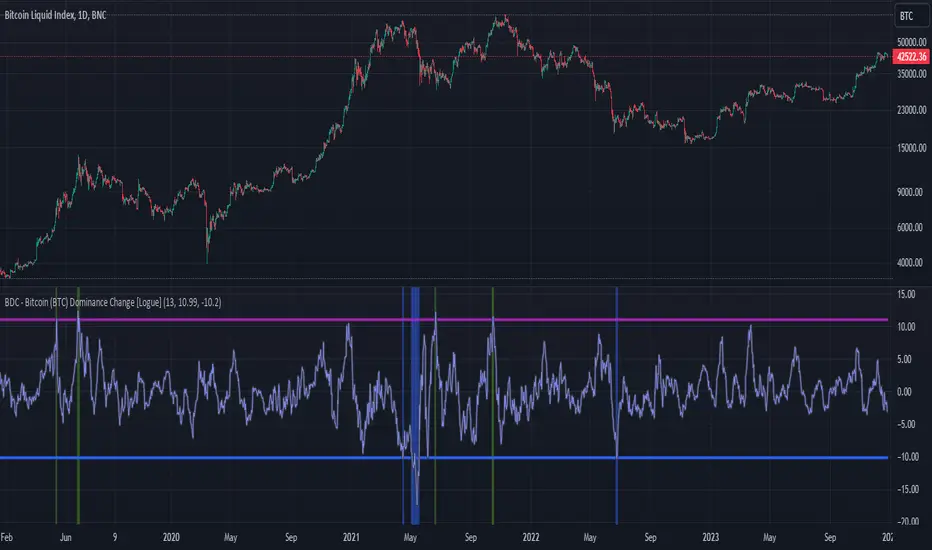
Bitcoin Dominance Change. Interesting things tend to happen when the Bitcoin dominance increases or decreases rapidly. Perhaps because there is overexuberance in the market in either BTC or the alts. In back testing, I found a rapid 13-day change in dominance indicates interesting switches in the BTC trends. Prior to 2019, the indicator doesn't work as well to signal trend shifts (i.e., local tops and bottoms) likely based on very few coins making up the crypto market.
The BTC dominance change is calculated as a percentage change of the daily dominance. You are able to change the upper bound, lower bound, and the period (daily) of the indicator to your own preferences. The indicator going above the upper bound or below the lower bound will trigger a different background color.
Use this indicator at your own risk. I make no claims as to its accuracy in forecasting future trend changes of Bitcoin.
開源腳本
秉持TradingView一貫精神,這個腳本的創作者將其設為開源,以便交易者檢視並驗證其功能。向作者致敬!您可以免費使用此腳本,但請注意,重新發佈代碼需遵守我們的社群規範。
免責聲明
這些資訊和出版物並非旨在提供,也不構成TradingView提供或認可的任何形式的財務、投資、交易或其他類型的建議或推薦。請閱讀使用條款以了解更多資訊。
免責聲明
這些資訊和出版物並非旨在提供,也不構成TradingView提供或認可的任何形式的財務、投資、交易或其他類型的建議或推薦。請閱讀使用條款以了解更多資訊。