OPEN-SOURCE SCRIPT
VWMA Multiple Timeframes
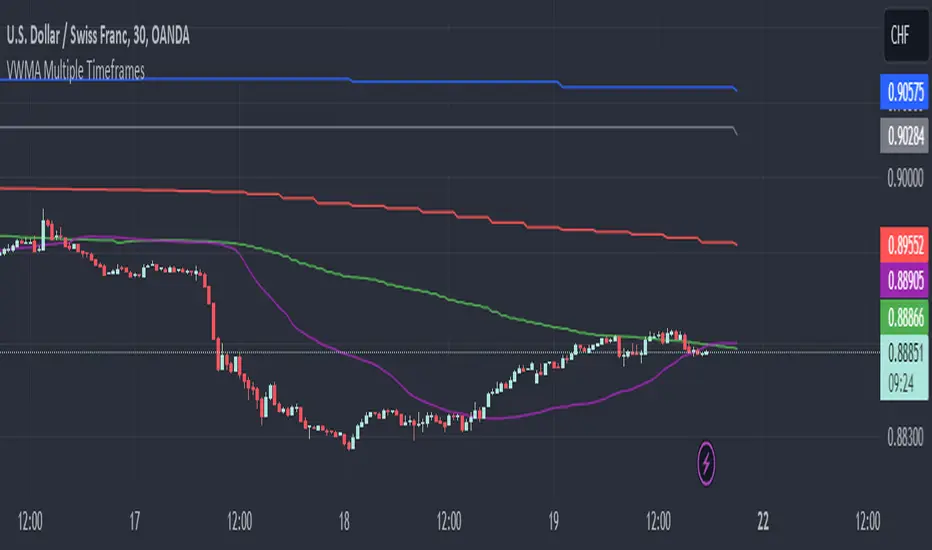
VWMA Multiple Timeframes Indicator
This TradingView indicator plots the Volume Weighted Moving Average (VWMA) across multiple timeframes on your chart. The VWMA is a type of moving average that gives more weight to periods with higher volume, making it a valuable tool for traders who want to incorporate volume into their technical analysis.
Features:
Multi-timeframe Analysis: This indicator calculates and plots the VWMA on five different timeframes:
Weekly (W)
Daily (D)
4 Hours (240 minutes)
1 Hour (60 minutes)
15 Minutes
Visual Representation: Each timeframe's VWMA is plotted with a different color, making it easy to distinguish between them on the chart:
Weekly VWMA: Gray
Daily VWMA: Blue
4 Hours VWMA: Red
1 Hour VWMA: Green
15 Minutes VWMA: Purple
How to Use:
Trend Identification: Use the VWMA to identify the direction of the trend on different timeframes. For example, if the VWMA is trending upwards on multiple timeframes, it indicates a strong upward trend.
Support and Resistance: The VWMA can act as dynamic support or resistance levels. Price bouncing off a VWMA line might indicate a continuation of the trend.
Volume Confirmation: The VWMA considers volume, making it useful for confirming the strength of price movements. High volume moves that cause the VWMA to change direction can be more significant than low volume moves.
This indicator is ideal for traders who use multi-timeframe analysis and want to incorporate volume into their trend and support/resistance identification. Feel free to customize the periods and timeframes to suit your trading style.
開源腳本
秉持TradingView一貫精神,這個腳本的創作者將其設為開源,以便交易者檢視並驗證其功能。向作者致敬!您可以免費使用此腳本,但請注意,重新發佈代碼需遵守我們的社群規範。
免責聲明
這些資訊和出版物並非旨在提供,也不構成TradingView提供或認可的任何形式的財務、投資、交易或其他類型的建議或推薦。請閱讀使用條款以了解更多資訊。
開源腳本
秉持TradingView一貫精神,這個腳本的創作者將其設為開源,以便交易者檢視並驗證其功能。向作者致敬!您可以免費使用此腳本,但請注意,重新發佈代碼需遵守我們的社群規範。
免責聲明
這些資訊和出版物並非旨在提供,也不構成TradingView提供或認可的任何形式的財務、投資、交易或其他類型的建議或推薦。請閱讀使用條款以了解更多資訊。