OPEN-SOURCE SCRIPT
IndiaView_IV
Disclaimer- This script is only for education purpose.
This script is special made for indiaview Friends.If u can learn about stock market. u can join. its free and always free of cost.
How to use this indicator-
Rules
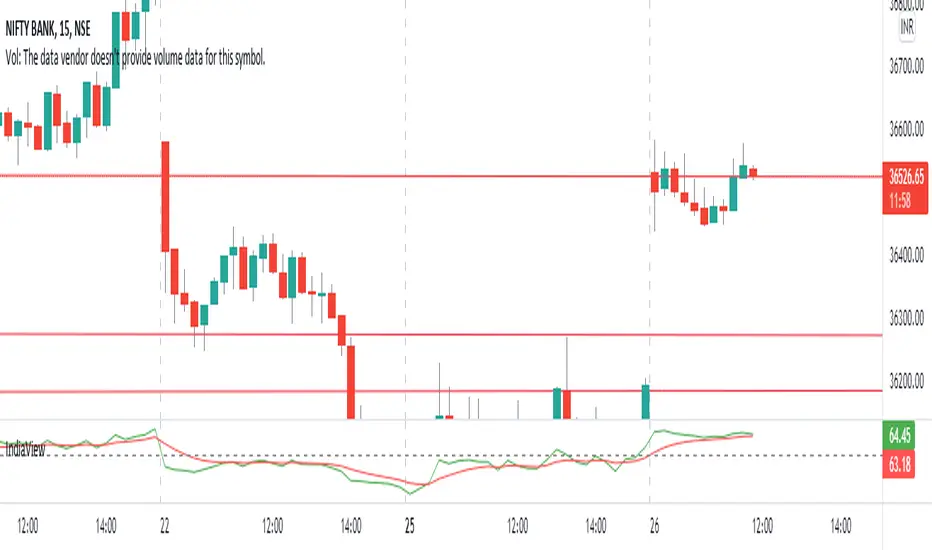
(i) No trend - when both lines are together the there is no trend in the market. only sideways market.
(ii) Bullish Market-Green Line above the red line mean bullish market.
(iii)Bearish Market-Red line above the green line means Bearish market.
50-50 line mean - Rsi line above the 50 the market may go Up. rsi below the 50 the market may go Down.
U Can use the indicator everywhere like Stock, future, options,currency, crypo and any other market.
This script is special made for indiaview Friends.If u can learn about stock market. u can join. its free and always free of cost.
How to use this indicator-
Rules
(i) No trend - when both lines are together the there is no trend in the market. only sideways market.
(ii) Bullish Market-Green Line above the red line mean bullish market.
(iii)Bearish Market-Red line above the green line means Bearish market.
50-50 line mean - Rsi line above the 50 the market may go Up. rsi below the 50 the market may go Down.
U Can use the indicator everywhere like Stock, future, options,currency, crypo and any other market.
開源腳本
秉持TradingView一貫精神,這個腳本的創作者將其設為開源,以便交易者檢視並驗證其功能。向作者致敬!您可以免費使用此腳本,但請注意,重新發佈代碼需遵守我們的社群規範。
免責聲明
這些資訊和出版物並非旨在提供,也不構成TradingView提供或認可的任何形式的財務、投資、交易或其他類型的建議或推薦。請閱讀使用條款以了解更多資訊。
免責聲明
這些資訊和出版物並非旨在提供,也不構成TradingView提供或認可的任何形式的財務、投資、交易或其他類型的建議或推薦。請閱讀使用條款以了解更多資訊。