PROTECTED SOURCE SCRIPT
Trend Momentum Algorithm
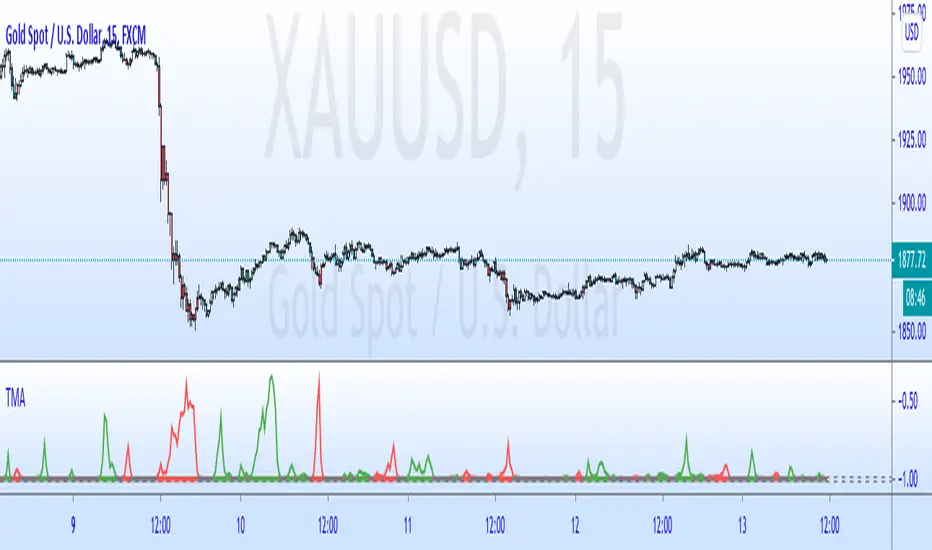
This algorithm comes from 2 inverse fisher transforms of a williams %R. After experimenting. I found that this is useful to understand the momentum of chart.
If green, only look for buy opportunities, if red, look for sells. If gray, look for whatever the previous colour was.
Can be useful with divergence. I'd look at a lower timeframe for confirmation (if divergence suggests turning bearish look for red on a lower timeframe. Be aware of the momentum on the timeframe above)
I put a tolerance filer on to help remove any smaller spikes. The larger the tolerance the less inaccuracies you will have but see the start of an new trend later.
This is a fun tool. Enjoy
受保護腳本
此腳本以閉源形式發佈。 不過,您可以自由使用,沒有任何限制 — 點擊此處了解更多。
免責聲明
這些資訊和出版物並非旨在提供,也不構成TradingView提供或認可的任何形式的財務、投資、交易或其他類型的建議或推薦。請閱讀使用條款以了解更多資訊。
免責聲明
這些資訊和出版物並非旨在提供,也不構成TradingView提供或認可的任何形式的財務、投資、交易或其他類型的建議或推薦。請閱讀使用條款以了解更多資訊。