PROTECTED SOURCE SCRIPT
BASED Momentum Oscillator
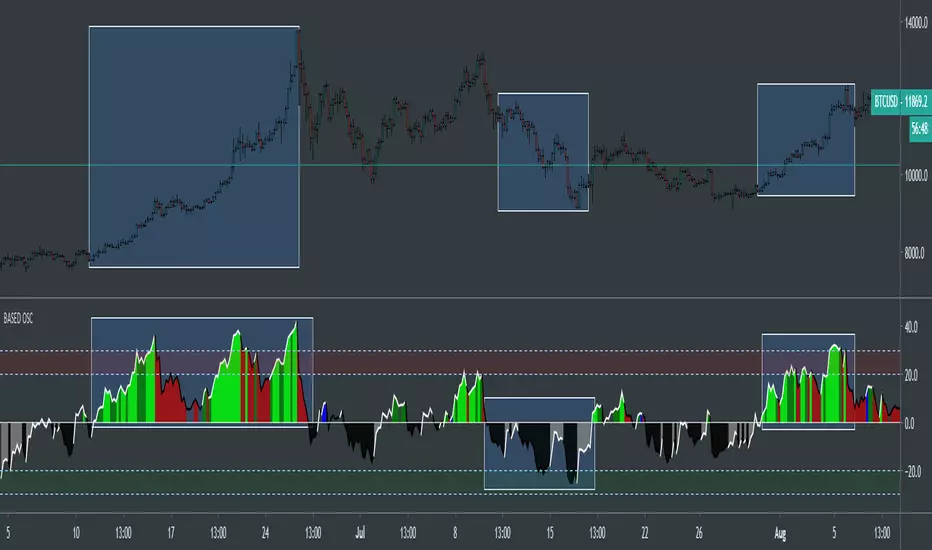
This is the BASED Momentum Oscillator. I have been working on this for awhile and it's been working really great! Can be used on any security on any timeframe. Spot entries during a bullish or bearish trend, oversold and overbought conditions, can be used to spot divergences.
When the oscillator reaches the red area on top, it means the security is entering overbought conditions. When the oscillator reaches the green area at bottom, it means the security is entering oversold conditions.
Lime = Strong uptrend
Green = Uptrend
Blue = Neutral uptrend
Red = Declining uptrend
Black = Bearish decline
Grey = Cautious recovery from Bearish decline
Blank Area = no signal
Should be used with two more indicators for confirmation.
Enjoy!
受保護腳本
此腳本以閉源形式發佈。 不過,您可以自由使用,沒有任何限制 — 點擊此處了解更多。
免責聲明
這些資訊和出版物並非旨在提供,也不構成TradingView提供或認可的任何形式的財務、投資、交易或其他類型的建議或推薦。請閱讀使用條款以了解更多資訊。
受保護腳本
此腳本以閉源形式發佈。 不過,您可以自由使用,沒有任何限制 — 點擊此處了解更多。
免責聲明
這些資訊和出版物並非旨在提供,也不構成TradingView提供或認可的任何形式的財務、投資、交易或其他類型的建議或推薦。請閱讀使用條款以了解更多資訊。