OPEN-SOURCE SCRIPT
已更新 Binance Open Interest (+SMA)
# Binance Open Interest + SMA
An indicator showing open interest (OI) in US dollars ($) for Binance USD-margined perpetual contracts. This means the indicator shows the total value of all open perpetual contracts on the Binance platform for the ticker being charted. As such, it can provide insights into market activity for an asset and trading interest, as rising open interest suggests many traders are opening new positions and new money is flowing into the market, and vice-versa. It is also an indicator of the liquidity of the asset's perpetuals contracts, as it reflects the amount of money in a given perpetuals market.
The candle data is shown as expected, with green candles indicating the IU at close is greater than at open, red indicating a lower OI at close than open, with the bodies indicating the open and close prices, and any wicks representing an OI value within that timeframe that went above or below the closing or opening OI.
Unlike other Binance open interest indicators on the platform, this one does not require user input and will automatically pull open interest data for the ticker being looked at, allowing for quicker access to open interest data. It also presents the open interest data in candle format, providing more detail into the open interest at a given timeframe.
Please note that this indicator will only work for assets which Binance offers USD-margined perpetual contracts for, and otherwise will not work.
## Instructions:
Simply add the indicator to your chart and open the asset you would like to chart. If a Binance perpetual contract exists for the asset, the open interest value will be charted. If no chart is generated, no Binance open interest data is available for charting.
To remove the SMA, uncheck the “SMA” box in the style section in the indicator settings. You can also change the source and length of time the SMA data is calculated from in the inputs section. By default, it is based off of the closing value and a length of 15 timeframes.
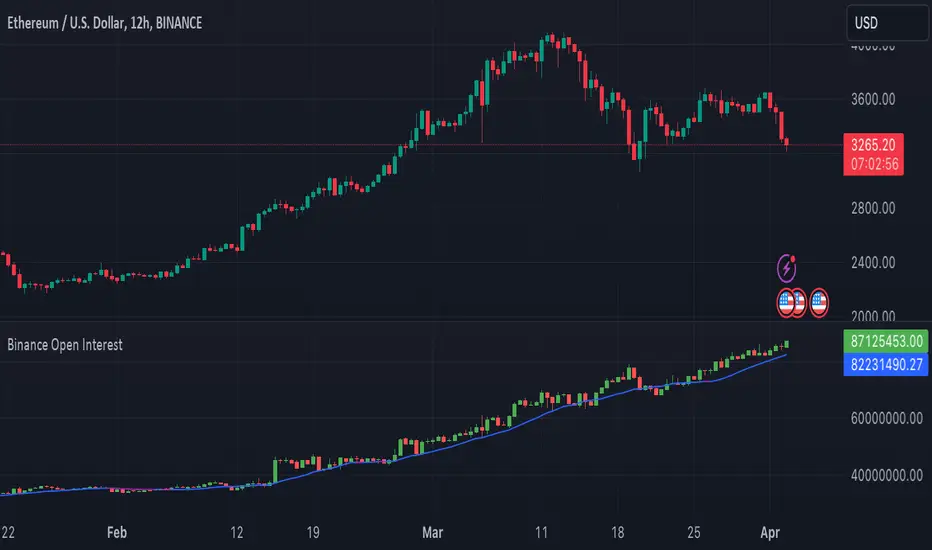
## Chart example:
The chart shows the price of Ethereum, and below it this indicator for open interest on Binance for their Ethereum perpetual contracts. We can see here open interest is rising steadily, indicating rising interest in holding perpetual contracts backed by Ethereum.
An indicator showing open interest (OI) in US dollars ($) for Binance USD-margined perpetual contracts. This means the indicator shows the total value of all open perpetual contracts on the Binance platform for the ticker being charted. As such, it can provide insights into market activity for an asset and trading interest, as rising open interest suggests many traders are opening new positions and new money is flowing into the market, and vice-versa. It is also an indicator of the liquidity of the asset's perpetuals contracts, as it reflects the amount of money in a given perpetuals market.
The candle data is shown as expected, with green candles indicating the IU at close is greater than at open, red indicating a lower OI at close than open, with the bodies indicating the open and close prices, and any wicks representing an OI value within that timeframe that went above or below the closing or opening OI.
Unlike other Binance open interest indicators on the platform, this one does not require user input and will automatically pull open interest data for the ticker being looked at, allowing for quicker access to open interest data. It also presents the open interest data in candle format, providing more detail into the open interest at a given timeframe.
Please note that this indicator will only work for assets which Binance offers USD-margined perpetual contracts for, and otherwise will not work.
## Instructions:
Simply add the indicator to your chart and open the asset you would like to chart. If a Binance perpetual contract exists for the asset, the open interest value will be charted. If no chart is generated, no Binance open interest data is available for charting.
To remove the SMA, uncheck the “SMA” box in the style section in the indicator settings. You can also change the source and length of time the SMA data is calculated from in the inputs section. By default, it is based off of the closing value and a length of 15 timeframes.
## Chart example:
The chart shows the price of Ethereum, and below it this indicator for open interest on Binance for their Ethereum perpetual contracts. We can see here open interest is rising steadily, indicating rising interest in holding perpetual contracts backed by Ethereum.
發行說明
# Binance Open Interest + SMA An indicator showing open interest (OI) in US dollars ($) for Binance USD-margined perpetual contracts. This means the indicator shows the total value of all open perpetual contracts on the Binance platform for the ticker being charted. As such, it can provide insights into market activity for an asset and trading interest, as rising open interest suggests many traders are opening new positions and new money is flowing into the market, and vice-versa. It is also an indicator of the liquidity of the asset's perpetuals contracts, as it reflects the amount of money in a given perpetuals market.
The candle data is shown as expected, with green candles indicating the IU at close is greater than at open, red indicating a lower OI at close than open, with the bodies indicating the open and close prices, and any wicks representing an OI value within that timeframe that went above or below the closing or opening OI.
Unlike other Binance open interest indicators on the platform, this one does not require user input and will automatically pull open interest data for the ticker being looked at, allowing for quicker access to open interest data. It also presents the open interest data in candle format, providing more detail into the open interest at a given timeframe.
Please note that this indicator will only work for assets which Binance offers USD-margined perpetual contracts for, and otherwise will not work.
## Instructions:
Simply add the indicator to your chart and open the asset you would like to chart. If a Binance perpetual contract exists for the asset, the open interest value will be charted. If no chart is generated, no Binance open interest data is available for charting.
To remove the SMA, uncheck the “SMA” box in the style section in the indicator settings. You can also change the source and length of time the SMA data is calculated from in the inputs section. By default, it is based off of the closing value and a length of 15 timeframes.
The indicator supports both USD and USDT markets.
## Chart example:
The chart shows the price of Ethereum, and below it this indicator for open interest on Binance for their Ethereum perpetual contracts. We can see here open interest is rising steadily, indicating rising interest in holding perpetual contracts backed by Ethereum.
開源腳本
秉持TradingView一貫精神,這個腳本的創作者將其設為開源,以便交易者檢視並驗證其功能。向作者致敬!您可以免費使用此腳本,但請注意,重新發佈代碼需遵守我們的社群規範。
免責聲明
這些資訊和出版物並非旨在提供,也不構成TradingView提供或認可的任何形式的財務、投資、交易或其他類型的建議或推薦。請閱讀使用條款以了解更多資訊。
免責聲明
這些資訊和出版物並非旨在提供,也不構成TradingView提供或認可的任何形式的財務、投資、交易或其他類型的建議或推薦。請閱讀使用條款以了解更多資訊。