OPEN-SOURCE SCRIPT
Advanced Volume Profile Levels (Working)

This indicator is a powerful tool for traders who use volume profile analysis to identify significant price levels. It automatically calculates and plots the three most critical levels derived from volume data—the Point of Control (POC), Value Area High (VAH), and Value Area Low (VAL)—for three different timeframes simultaneously: the previous week, the previous day, and the current, live session.
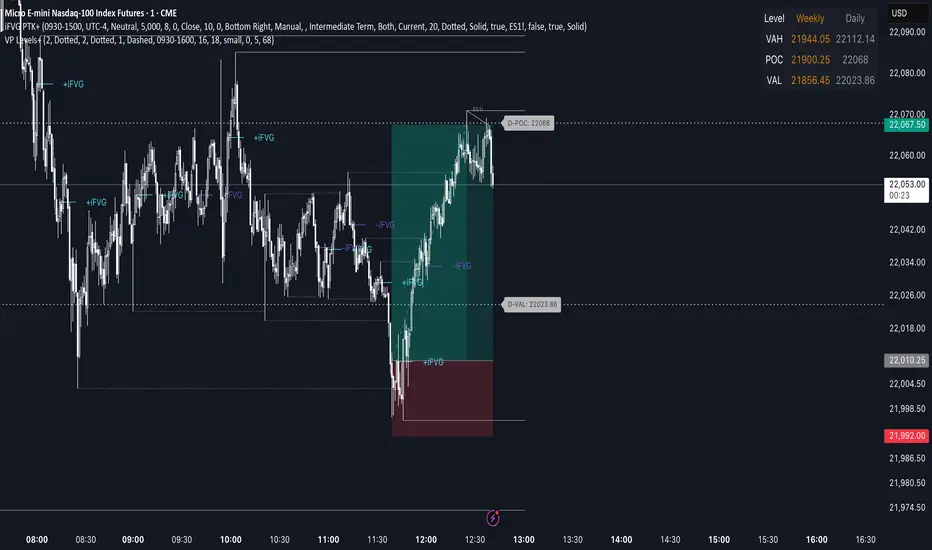
The primary focus of this indicator is unmatched readability. It features dynamic, floating labels that stay clear of price action, combined with a high-contrast design to ensure you can see these crucial levels at a glance without any visual clutter.
Key Features
Multi-Session Analysis: Gain a complete market perspective by viewing levels from different timeframes on a single chart.
Weekly Levels: Identify the long-term areas of value and control from the prior week's trading activity.
Daily Levels: Pinpoint the most significant levels from the previous day's Regular Trading Hours (9:30 AM - 4:00 PM ET).
Current Session Levels: Track the developing value area and POC in real-time with a dynamic profile that updates with every bar.
Advanced Visuals for Clarity:
Floating Labels: The labels for the weekly and daily levels intelligently "float" on the right side of your chart, moving with the price to ensure they are never obscured by candles.
High-Contrast Design: Labels are designed for maximum readability with solid, opaque backgrounds and an automatic text color (black or white) that provides the best contrast against your chosen level color.
Trailing Current Levels: The labels for the current session neatly trail the most recent price action, providing an intuitive view of intra-day developments.
Comprehensive Customization: Tailor the indicator's appearance to your exact preferences.
Toggle each profile (Weekly, Daily, Current) on or off.
Individually set the color, line style (solid, dashed, dotted), and line width for each set of levels.
Adjust the text size, background transparency, and horizontal offset for all on-chart labels.
Information Hub:
On-Chart Price Labels: Each label clearly displays both the level name and its precise price (e.g., "D-POC: 22068.50").
Corner Table: An optional, clean table in the top-right corner provides a quick summary of all active weekly and daily level values.
Built-in Alerts:
Create alerts directly from the script to be notified whenever the price crosses above or below the weekly or daily Point of Control, helping you stay on top of key market movements.
How to Use
The levels provided by this indicator serve as powerful reference points for market activity:
Point of Control (POC): The price level with the highest traded volume. It acts as a magnet for price and represents the area of "fair value" for that session. Markets often test or revert to the POC.
Value Area High (VAH) & Value Area Low (VAL): These levels define the range where approximately 70% of the session's volume occurred. They are critical support and resistance zones.
Price acceptance above the VAH may signal a bullish breakout.
Price acceptance below the VAL may signal a bearish breakdown.
Rejection at the VAH or VAL often leads to price moving back across the value area towards the POC.
開源腳本
秉持TradingView一貫精神,這個腳本的創作者將其設為開源,以便交易者檢視並驗證其功能。向作者致敬!您可以免費使用此腳本,但請注意,重新發佈代碼需遵守我們的社群規範。
免責聲明
這些資訊和出版物並非旨在提供,也不構成TradingView提供或認可的任何形式的財務、投資、交易或其他類型的建議或推薦。請閱讀使用條款以了解更多資訊。
開源腳本
秉持TradingView一貫精神,這個腳本的創作者將其設為開源,以便交易者檢視並驗證其功能。向作者致敬!您可以免費使用此腳本,但請注意,重新發佈代碼需遵守我們的社群規範。
免責聲明
這些資訊和出版物並非旨在提供,也不構成TradingView提供或認可的任何形式的財務、投資、交易或其他類型的建議或推薦。請閱讀使用條款以了解更多資訊。