OPEN-SOURCE SCRIPT
已更新 DW-MTF-Close Price(1W/3D) as Support Line
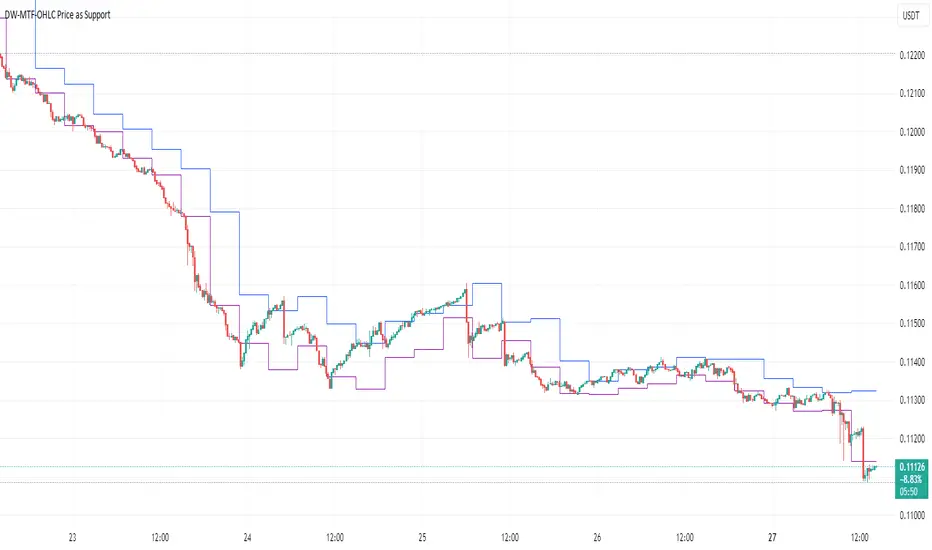
This simple study shows closing price of [up to 2] higher timeframes on your chart. Be sure to use a lower timeframe on your chart itself.
發行說明
Repainting Removed發行說明
Updated according to rules (RSI's removed). Code cleaned up.發行說明
This Indicator has been enhanced.In the past, only Close price could used for the 2 support lines. With this update it is possible to select source - Open, High, Low, Close etc. This is especially useful for tracking price movements on e.g. 15m within 4h low and high support lines.
Example 1:
Support line 1 - 1 DAY close
Support line 2 - 3 DAY close
2 support lines for buying and selling above/below.
Example 2:
Support line 1 - 4h LOW
Support line 2 - 4H HIGH
If your current timeframe on chart is 15m, track the prices changes within the LOW/HIGH of 4h
發行說明
Default colors changed to blue and purple 開源腳本
秉持TradingView一貫精神,這個腳本的創作者將其設為開源,以便交易者檢視並驗證其功能。向作者致敬!您可以免費使用此腳本,但請注意,重新發佈代碼需遵守我們的社群規範。
免責聲明
這些資訊和出版物並非旨在提供,也不構成TradingView提供或認可的任何形式的財務、投資、交易或其他類型的建議或推薦。請閱讀使用條款以了解更多資訊。
開源腳本
秉持TradingView一貫精神,這個腳本的創作者將其設為開源,以便交易者檢視並驗證其功能。向作者致敬!您可以免費使用此腳本,但請注意,重新發佈代碼需遵守我們的社群規範。
免責聲明
這些資訊和出版物並非旨在提供,也不構成TradingView提供或認可的任何形式的財務、投資、交易或其他類型的建議或推薦。請閱讀使用條款以了解更多資訊。