OPEN-SOURCE SCRIPT
Ceres Trader Inv DXY % Overlay
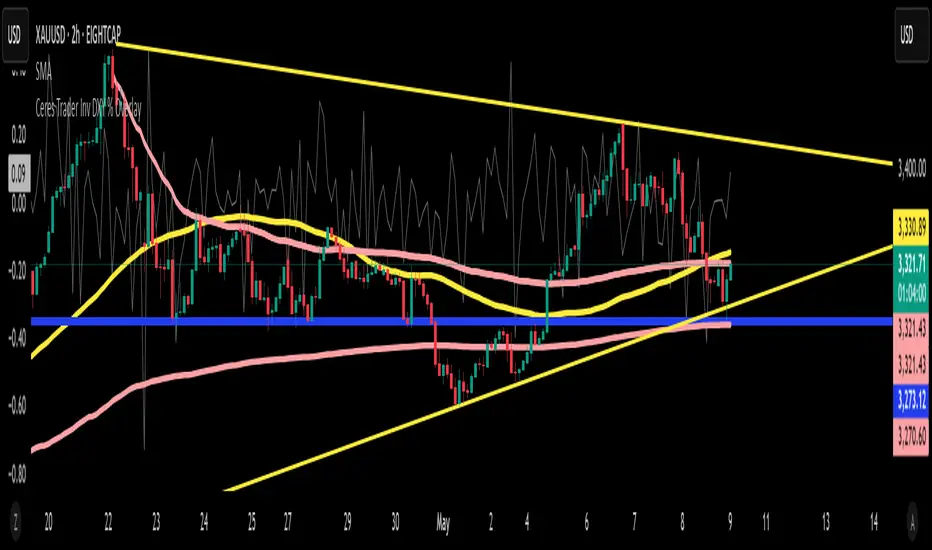
Introducing the “Inverse DXY % Overlay” for TradingView
What it does:
• Plots the U.S. Dollar Index (DXY) as an inverted %-change line directly over your primary chart (e.g. XAUUSD).
• Dollar strength shows as a downward line; dollar weakness shows as an upward line—instantly highlighting negative correlation.
Why it helps:
• Trend confirmation – Ride Gold breakouts only when the dollar is actually weakening.
• Divergence signals – Spot early turn setups when Gold and DXY % don’t move in sync.
• Risk management – Trim or tighten stops when the dollar pivots against your position.
Key features:
Overlay on any symbol (Gold, Silver, Oil, Crypto, equities)
Auto-scaled to left-axis %, so your price chart stays on the right
Lightweight & transparent—1 px grey line, minimal clutter
Now you’ll have a real-time, inverted DXY % line beneath your candles—perfect for gauging USD flow before you pull the trigger on any trade.
Happy trading! 🚀
—Michael (Ceres Trader)
開源腳本
秉持TradingView一貫精神,這個腳本的創作者將其設為開源,以便交易者檢視並驗證其功能。向作者致敬!您可以免費使用此腳本,但請注意,重新發佈代碼需遵守我們的社群規範。
Message Me to Join My Private, Premium Telegram Signals Channel. Also available for private coaching and trading sessions. t.me/CeresTraderSignals
免責聲明
這些資訊和出版物並非旨在提供,也不構成TradingView提供或認可的任何形式的財務、投資、交易或其他類型的建議或推薦。請閱讀使用條款以了解更多資訊。