OPEN-SOURCE SCRIPT
RSI EMA SMA Strat
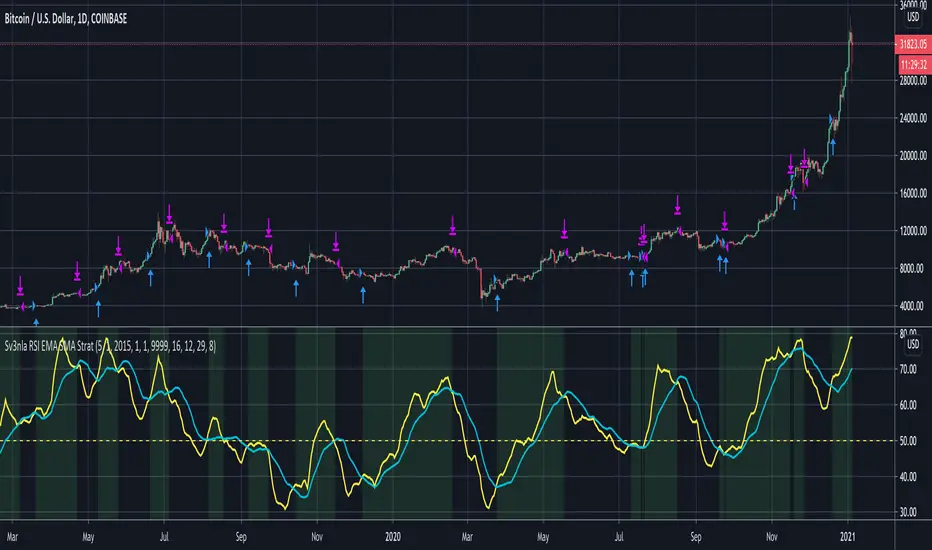
This script looks at the RSI EMA and RSI SMA crossovers when above a certain price EMA
It was mainly written for swingtrading and only for long positions on a daily timeframe for BTC and ETH. They idea is to have a script that indicates when to convert your BTC /ETC to a stable coin and when to buy in again.
You could try to use it for other positions (short, long, etc..) and other coins but I didn't test these.
When the RSI EMA & SMA hover around 50 for a few days in flat lines and you get a buy signal it may be best to wait a few days longer to see what direction they take.
The default values for RSI EMA , RSI SMA and price EMA gave the best return (start out with an amount of x coins in 2015 and end up with the biggest possible amount of coins today). Again, this was only tested on daily. Feel free to tweak these when using other timeframes or other coins
開源腳本
秉持TradingView一貫精神,這個腳本的創作者將其設為開源,以便交易者檢視並驗證其功能。向作者致敬!您可以免費使用此腳本,但請注意,重新發佈代碼需遵守我們的社群規範。
免責聲明
這些資訊和出版物並非旨在提供,也不構成TradingView提供或認可的任何形式的財務、投資、交易或其他類型的建議或推薦。請閱讀使用條款以了解更多資訊。
免責聲明
這些資訊和出版物並非旨在提供,也不構成TradingView提供或認可的任何形式的財務、投資、交易或其他類型的建議或推薦。請閱讀使用條款以了解更多資訊。