OPEN-SOURCE SCRIPT
Quarters Theory
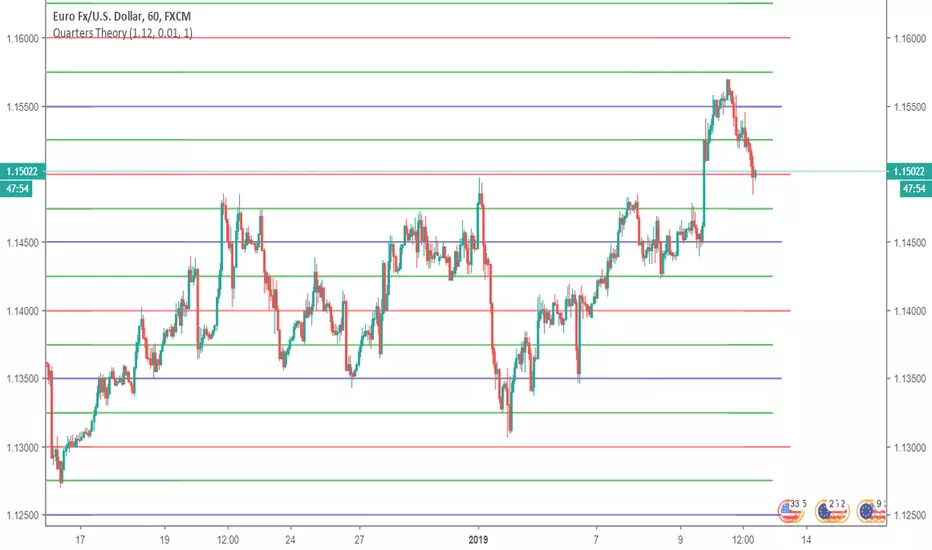
Indicator that lets you to put Whole (red), Half (blue) and Quarter (green) levels on a chart, which work as support/resistance levels. Defaults are only for EURUSD, for other symbols you have to change the settings. First input is "Starting Price (Bottom)", which should be the lowest point you want your levels to be. There are only 10 Whole levels on this indicator, but if you want you could add them from pine editor. The next input is "Next Whole Level" this is the price from one whole level to next whole level, for example for EURUSD it is 0.01. The third input is for removing the quarter lines (green lines), if you want to remove them set this option to "0", otherways leave this to "1".
This indicator looks very good on JPY and NZD pairs.


Works on long term too:

Learned from him: youtube.com/watch?v=QLrtBPtKPBA
This indicator looks very good on JPY and NZD pairs.
Works on long term too:
Learned from him: youtube.com/watch?v=QLrtBPtKPBA
開源腳本
秉持TradingView一貫精神,這個腳本的創作者將其設為開源,以便交易者檢視並驗證其功能。向作者致敬!您可以免費使用此腳本,但請注意,重新發佈代碼需遵守我們的社群規範。
免責聲明
這些資訊和出版物並非旨在提供,也不構成TradingView提供或認可的任何形式的財務、投資、交易或其他類型的建議或推薦。請閱讀使用條款以了解更多資訊。
開源腳本
秉持TradingView一貫精神,這個腳本的創作者將其設為開源,以便交易者檢視並驗證其功能。向作者致敬!您可以免費使用此腳本,但請注意,重新發佈代碼需遵守我們的社群規範。
免責聲明
這些資訊和出版物並非旨在提供,也不構成TradingView提供或認可的任何形式的財務、投資、交易或其他類型的建議或推薦。請閱讀使用條款以了解更多資訊。