OPEN-SOURCE SCRIPT
Periodic price change comparison
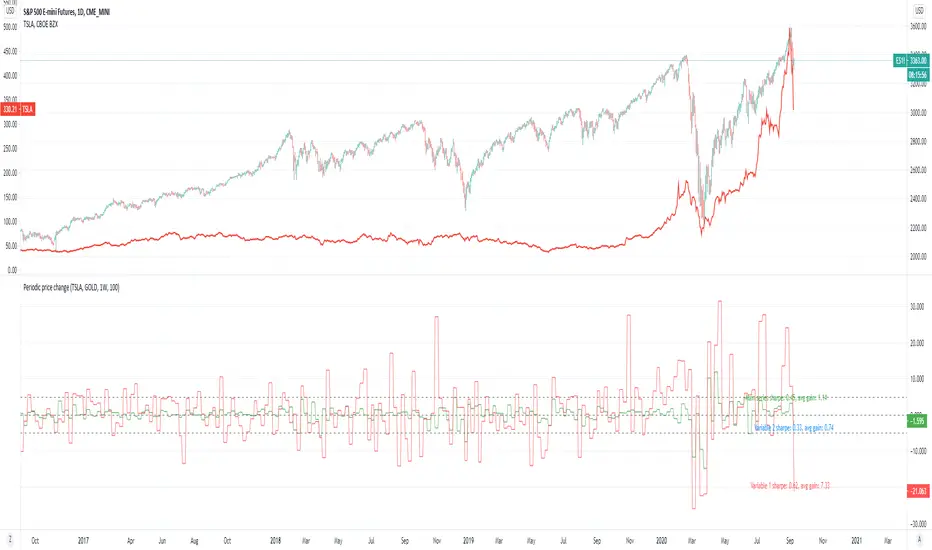
Periodic price change.
Application:
Sector rotation analysis by comparing different tickers.
Simple statistical analysis (with lookback period) for knowing how good they were.
If you are a believer in sector rotation, you can add different sector stocks to see which of them are lagged behind and buy them.
In this example, you could see tesla periodically fall behind the market. You can buy it when it is on that zone.
And you can also refer to the sharpe ratio and the average gain rate on the chart to see how good the stocks were.
開源腳本
秉持TradingView一貫精神,這個腳本的創作者將其設為開源,以便交易者檢視並驗證其功能。向作者致敬!您可以免費使用此腳本,但請注意,重新發佈代碼需遵守我們的社群規範。
免責聲明
這些資訊和出版物並非旨在提供,也不構成TradingView提供或認可的任何形式的財務、投資、交易或其他類型的建議或推薦。請閱讀使用條款以了解更多資訊。
開源腳本
秉持TradingView一貫精神,這個腳本的創作者將其設為開源,以便交易者檢視並驗證其功能。向作者致敬!您可以免費使用此腳本,但請注意,重新發佈代碼需遵守我們的社群規範。
免責聲明
這些資訊和出版物並非旨在提供,也不構成TradingView提供或認可的任何形式的財務、投資、交易或其他類型的建議或推薦。請閱讀使用條款以了解更多資訊。