OPEN-SOURCE SCRIPT
已更新 MTF PO3 Big Candle By Rouro
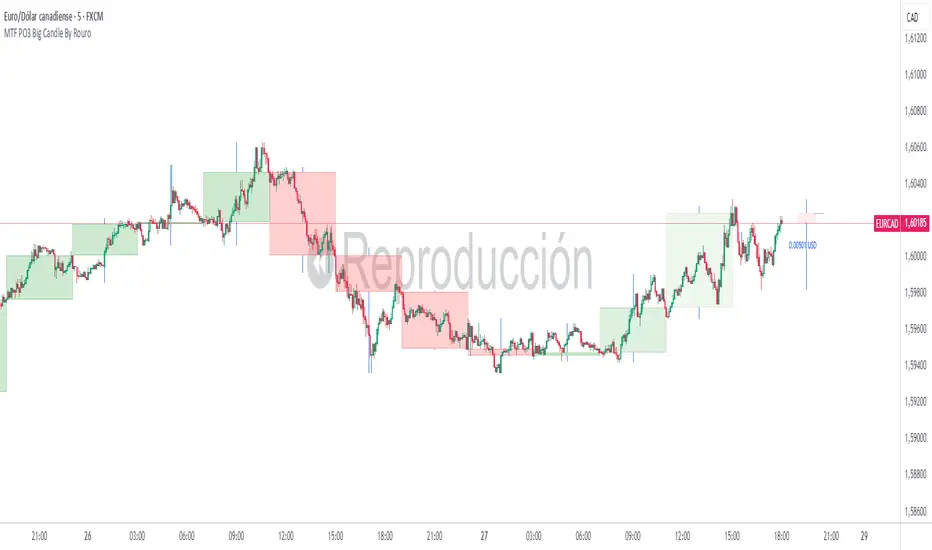
📊 MTF PO3 Big Candle By Rouro
This indicator allows you to visualize candles from higher timeframes (HTF) directly on lower timeframe charts.
It draws:
📉 Past candles from the selected HTF.
📈 A projected current candle of a chosen timeframe, extended to the right of the chart.
It's ideal for traders who want to align decisions on lower timeframes with key HTF structures.
⚙️ Inputs & Configuration
🕐 Past Candle Timeframe
Selects the timeframe to visualize historical candles.
(e.g., 4H on a 5-minute chart)
📅 Projected Candle Timeframe
Chooses the timeframe for the current (live) candle that is drawn to the right of the chart.
(e.g., 1D)
➡️ Right Displacement (bars)
Controls how far to the right the projected candle is drawn.
🟩 Bullish Body Color
Defines the color of bullish candle bodies.
🟥 Bearish Body Color
Defines the color of bearish candle bodies.
🔵 Wick Color
Color of the high/low wicks.
🔲 Body Transparency (0–100)
Controls the transparency of the candle body fill.
📌 Show Wicks
Enables or disables drawing of the wicks on all candles.
💡 Notes
If the projected candle is from a very large timeframe (e.g., 1D) and you are on a small timeframe (e.g., 5m), the projection length is limited to avoid overlapping the chart.
All candle shapes update in real time.
The indicator is optimized for performance and includes fail-safes for TradingView's limits.
💬 Support
If you have any questions, feel free to ask in the comments.
If this indicator has been useful or valuable for your trading, please leave a comment saying so — your feedback helps the community and supports the publication process.
✅ Compliant with TradingView’s house rules: No ads, sales, links, or misleading claims.
📌 This is a visual utility tool designed to support multi-timeframe analysis.
發行說明
📊 MTF PO3 Big Candle By RouroThis indicator allows you to visualize candles from higher timeframes (HTF) directly on lower timeframe charts.
It draws:
📉 Past candles from the selected HTF.
📈 A projected current candle of a chosen timeframe, extended to the right of the chart.
It's ideal for traders who want to align decisions on lower timeframes with key HTF structures.
⚙️ Inputs & Configuration
🕐 Past Candle Timeframe
Selects the timeframe to visualize historical candles.
(e.g., 4H on a 5-minute chart)
📅 Projected Candle Timeframe
Chooses the timeframe for the current (live) candle that is drawn to the right of the chart.
(e.g., 1D)
➡️ Right Displacement (bars)
Controls how far to the right the projected candle is drawn.
🟩 Bullish Body Color
Defines the color of bullish candle bodies.
🟥 Bearish Body Color
Defines the color of bearish candle bodies.
🔵 Wick Color
Color of the high/low wicks.
🔲 Body Transparency (0–100)
Controls the transparency of the candle body fill.
📌 Show Wicks
Enables or disables drawing of the wicks on all candles.
💡 Notes
If the projected candle is from a very large timeframe (e.g., 1D) and you are on a small timeframe (e.g., 5m), the projection length is limited to avoid overlapping the chart.
All candle shapes update in real time.
The indicator is optimized for performance and includes fail-safes for TradingView's limits.
💬 Support
If you have any questions, feel free to ask in the comments.
If this indicator has been useful or valuable for your trading, please leave a comment saying so — your feedback helps the community and supports the publication process.
✅ Compliant with TradingView’s house rules: No ads, sales, links, or misleading claims.
📌 This is a visual utility tool designed to support multi-timeframe analysis.
Update 1.2The error that the last candle was not marked correctly has been fixed.
開源腳本
秉持TradingView一貫精神,這個腳本的創作者將其設為開源,以便交易者檢視並驗證其功能。向作者致敬!您可以免費使用此腳本,但請注意,重新發佈代碼需遵守我們的社群規範。
免責聲明
這些資訊和出版物並非旨在提供,也不構成TradingView提供或認可的任何形式的財務、投資、交易或其他類型的建議或推薦。請閱讀使用條款以了解更多資訊。
免責聲明
這些資訊和出版物並非旨在提供,也不構成TradingView提供或認可的任何形式的財務、投資、交易或其他類型的建議或推薦。請閱讀使用條款以了解更多資訊。