OPEN-SOURCE SCRIPT
已更新 Financial Astrology Moon Longitude
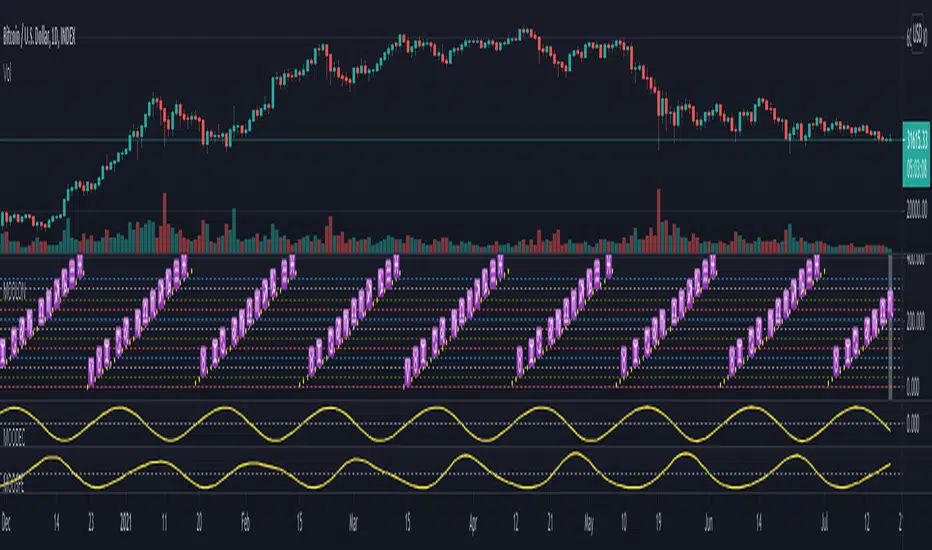
Moon energy represent the masses, crowds, public places, children and emotions. The transit of the Moon through the zodiacal signs will color the crowd emotional responses that fluctuate based on the elemental qualities of the signs: fire (energetic and impulsive), earth (rigid, static, patient), water (assimilation, transformation, humor fluctuations), air (expansion, fervent, germination).
The daily average speed of the Moon is 13 degrees, for this reason the emotional elemental energy is transforming in average every 2 days and few hours, this mood fluctuations produces the short term instinctive and emotional actions performed by traders that forget the precise mathematical / statistical approach in favor of irrational and emotional impulses.
Based on statistical buy/sell frequency analysis we discovered that for BTC-USD, the Moon is usually bullish in zodiac signs: Aries, Libra, Scorpio, Aquarius and Pisces, the most relevant bullish sign is "Aquarius", from 206 observations in all the BTC-USD price history where Moon was in this sign the 60% of those days the price increased compared to the previous day. The bearish zodiac signs for BTC-USD are: Taurus, Cancer, Leo, Sagittarius and Capricorn, the most relevant bearish sign is "Capricorn".
Interestingly this zodiac sign locations tends to fluctuate during some periods of time and from the last 10 observations of the Moon transiting through Aries we noted that 7 of the 10 observations coincide with a dip, sometimes the Moon in Aries indicate the reversal of the short term trend, this is kind of expected considering that when Moon approaches Taurus the fall becomes more likely due to the fact that Moon in Taurus is a bearish signal.
With this indicator there is unlimited possibilities to explore across different markets and complementing with Moon phases this may be the perfect financial astrology indicator for those intraday traders that keep positions only for few hours.
We encourage you to analyze the Moon zodiac sign cycles in different markets and share with us your observations, leave us a comment with your research outcomes. Happy trading!
Note: The Moon longitude indicator is based on an ephemeris array that covers years 2010 to 2030, prior or after this years the longitude is not available, this daily ephemeris are based on UTC time so in order to align properly with the price bars times you should set UTC as your chart reference timezone.
發行說明
Improved the representation of longitude zodiac sign boundaries with horizontal lines and symbols icons and updated to two digits precision longitude.開源腳本
秉持TradingView一貫精神,這個腳本的創作者將其設為開源,以便交易者檢視並驗證其功能。向作者致敬!您可以免費使用此腳本,但請注意,重新發佈代碼需遵守我們的社群規範。
免責聲明
這些資訊和出版物並非旨在提供,也不構成TradingView提供或認可的任何形式的財務、投資、交易或其他類型的建議或推薦。請閱讀使用條款以了解更多資訊。
免責聲明
這些資訊和出版物並非旨在提供,也不構成TradingView提供或認可的任何形式的財務、投資、交易或其他類型的建議或推薦。請閱讀使用條款以了解更多資訊。