OPEN-SOURCE SCRIPT
SPX ATR14 indicator
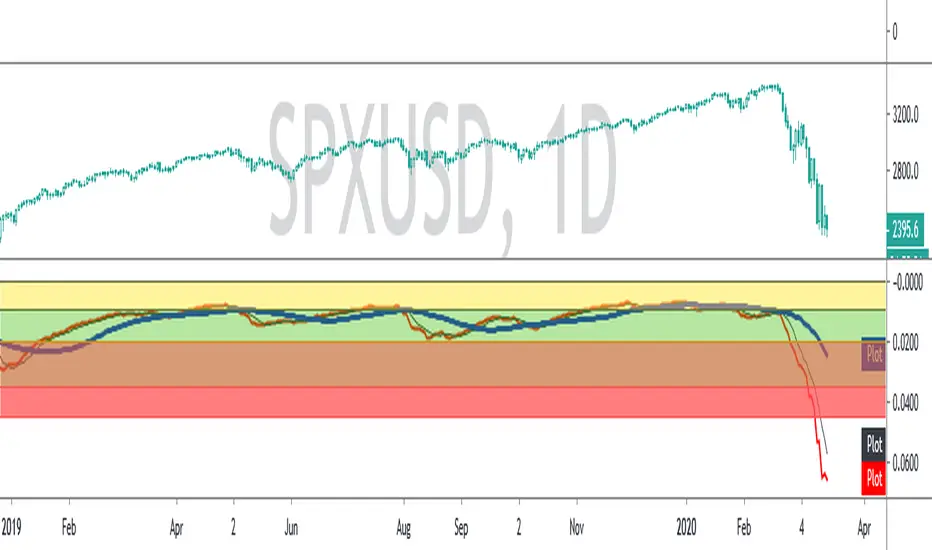
This indicator works well on SPX 500
Needs to be inverted so Red is at the bottom
Levels of pullbacks are used to determine trend .
Pullback to the Green zone normal Bull Market
Pullback to the Brown Zone are warning of potential Bear Market , but if it holds , just a deeper correction within a Bull Market
Pullbacks into the Red , Bear Market .
In Bear , wait until indicator is forming a reversal trend up and price should make a divergence by either making a new low or retesting previous low.
The Blue MA is the 33 MA and can be used as a form of stop trend indicator on the cross below the MA
開源腳本
秉持TradingView一貫精神,這個腳本的創作者將其設為開源,以便交易者檢視並驗證其功能。向作者致敬!您可以免費使用此腳本,但請注意,重新發佈代碼需遵守我們的社群規範。
免責聲明
這些資訊和出版物並非旨在提供,也不構成TradingView提供或認可的任何形式的財務、投資、交易或其他類型的建議或推薦。請閱讀使用條款以了解更多資訊。
開源腳本
秉持TradingView一貫精神,這個腳本的創作者將其設為開源,以便交易者檢視並驗證其功能。向作者致敬!您可以免費使用此腳本,但請注意,重新發佈代碼需遵守我們的社群規範。
免責聲明
這些資訊和出版物並非旨在提供,也不構成TradingView提供或認可的任何形式的財務、投資、交易或其他類型的建議或推薦。請閱讀使用條款以了解更多資訊。