OPEN-SOURCE SCRIPT
已更新 RSI Zones
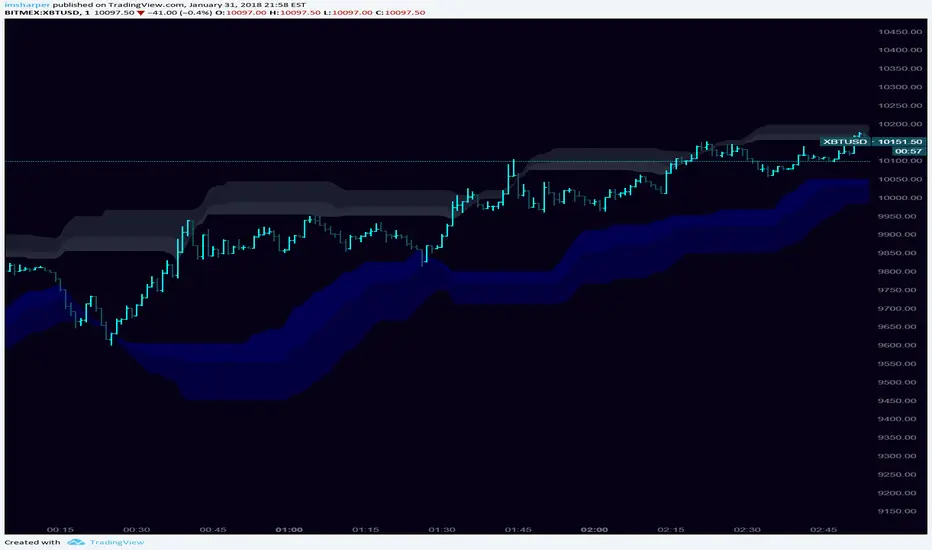
This is a combination of a couple ideas I saw on here. The result is from three configurable EMA smoothed RSI overbought/oversold zones. The default is set to Donchian Channel mode where the highs/lows of the RSI's are plotted. An optional basis line derived from the slowest RSI is also included. Toggling this mode off gives you different results.
You'll want to play with different lengths for your own preferences and to see what works best for you.
Being able to see price bounce between these zones should hopefully give you some ideas on how you could potentially use this.
Credit to LazyBear for the initial idea.
https://www.tradingview.com/script/zWq2YfzA-RSI-Bands-RSI-B-and-RSI-Bandwidth/
發行說明
Added the ability to select source for the upper/lower zones for each RSI and defaulted things to high/low instead of close.開源腳本
秉持TradingView一貫精神,這個腳本的創作者將其設為開源,以便交易者檢視並驗證其功能。向作者致敬!您可以免費使用此腳本,但請注意,重新發佈代碼需遵守我們的社群規範。
免責聲明
這些資訊和出版物並非旨在提供,也不構成TradingView提供或認可的任何形式的財務、投資、交易或其他類型的建議或推薦。請閱讀使用條款以了解更多資訊。
免責聲明
這些資訊和出版物並非旨在提供,也不構成TradingView提供或認可的任何形式的財務、投資、交易或其他類型的建議或推薦。請閱讀使用條款以了解更多資訊。