OPEN-SOURCE SCRIPT
AO-Zone
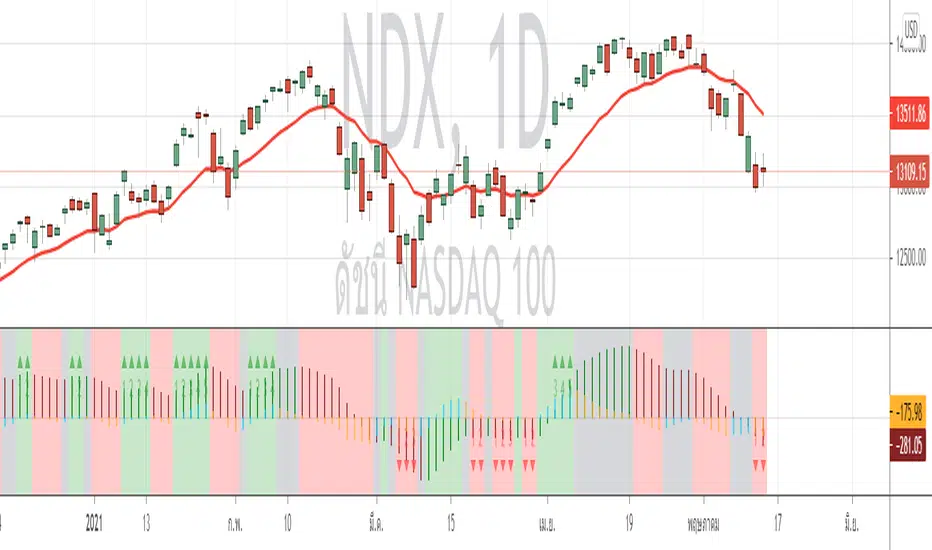
The Zone is mention in New Trading Dimensions by Bill Williams,PhD.
The Zone is used for Entry Signal
Green Zone are painting Green when Awesome Oscillator (AO) and Accelerater/Decelerator (AC) are both increasing.
Red Zone are painting Red when Awesome Oscillator (AO) and Accelerater/Decelerator (AC) are both decreasing.
Gray Zone are painting Gray when AO and AC in difference changing
Gray Zone are indicate the indecision between bulls and bears.
Bill Williams, PhD. mention that Green Zone or Red Zone usually happen 6-8 bars Continuously.
(in my opinion, it happen lower than in intraday time frame)
The First Bar that change to be Green or Red color is the Signal Bar.
Entry Signal is the second bar in the same color as the Signal bar happen with Volume
Price go higher the high of previous Green Bar is Buy Signal. Entry Buy (Long) and place Stop at 1 tick lower the Low of previous bar.
Price go lower the Low of previous Red Bars is Sell Signal. Entry Sell (Short) and place Stop at 1 tick higher the High of previous bar.
Can Entry from 2nd bar to 5th bar.
Do not Entry if Green Bars or Red Bars completed 5 bars continuously.
This indicator have AO , AC and Zone in 1 tools and there are counter to show the number of Green bar or Red bar.
Green counter will happen when AO >0 and Green zone because AO > 0 show uptrend condition.
Red Counter will happen when AO < 0 and Red Zone because AO <0 show downtrend condition.
When we entry , we should follow the trend. So I design to non-show the counter if zone is against the trend.
#WaveRiders
開源腳本
秉持TradingView一貫精神,這個腳本的創作者將其設為開源,以便交易者檢視並驗證其功能。向作者致敬!您可以免費使用此腳本,但請注意,重新發佈代碼需遵守我們的社群規範。
Pragasit Thitaram, CEWA
免責聲明
這些資訊和出版物並非旨在提供,也不構成TradingView提供或認可的任何形式的財務、投資、交易或其他類型的建議或推薦。請閱讀使用條款以了解更多資訊。
開源腳本
秉持TradingView一貫精神,這個腳本的創作者將其設為開源,以便交易者檢視並驗證其功能。向作者致敬!您可以免費使用此腳本,但請注意,重新發佈代碼需遵守我們的社群規範。
Pragasit Thitaram, CEWA
免責聲明
這些資訊和出版物並非旨在提供,也不構成TradingView提供或認可的任何形式的財務、投資、交易或其他類型的建議或推薦。請閱讀使用條款以了解更多資訊。