OPEN-SOURCE SCRIPT
已更新 VWAP Trend with Standard Deviation & Midlines
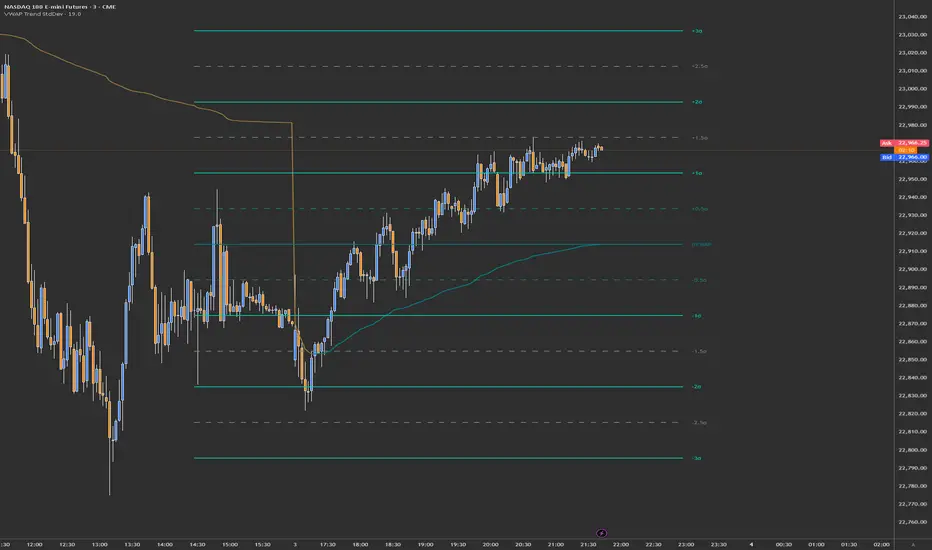
This indicator is a sophisticated VWAP (Volume Weighted Average Price) tool with multiple features:
Core Functionality:
1. Calculates a primary VWAP line that changes color based on trend direction (green when rising, red when falling)
2. Creates multiple standard deviation bands around the VWAP at customizable distances
3. Resets calculations at either:
- New York session start time (configurable, default 9:30 AM)
- Daily start time
- Can be hidden on daily/weekly/monthly timeframes if desired
Band Structure:
- Band 1 (innermost): ±1 standard deviation
- Band 2 (middle): ±2 standard deviations
- Band 3 (outermost): ±3 standard deviations
- Midlines at 0.5σ intervals between bands
- All bands can be individually enabled/disabled
Customization Options:
1. Band calculation modes:
- Standard Deviation based
- Percentage based
2. Visual settings:
- Customizable colors for all elements
- Adjustable line widths
- Optional labels with configurable size
- Optional extension lines
- Label position adjustment
3. Source data selection (default: HLC3 - High, Low, Close average)
Common Uses:
- Identifying potential support/resistance levels
- Measuring price volatility
- Spotting mean reversion opportunities
- Trading range analysis
- Trend direction confirmation
The indicator essentially creates a dynamic support/resistance structure that adapts to market volatility and volume, making it useful for both intraday and swing trading strategies.
發行說明
# VWAP Trend with Standard Deviation & MidlinesA clean, modern TradingView Pine Script indicator for visualizing VWAP (Volume Weighted Average Price) with customizable standard deviation bands and midlines. Designed for clarity, neutrality, and professional use.
---
## Features
- **VWAP Core**: Plots the VWAP line, dynamically colored by trend (up/down).
- **Standard Deviation Bands**: Up to three bands, each with user-defined multipliers and neutral color palette.
- **Midlines**: Visual midpoints between bands for enhanced confluence.
- **Session Awareness**: Option to start VWAP at NY session open or daily.
- **Customizable Colors**: All colors use a neutral, clean palette (teal, brown, gray) for professional charting.
- **Trend-Based Band Coloring**: Optional dynamic coloring for bands based on VWAP trend.
- **Labels & Lines**: Automatic labeling and line drawing for all levels, with adjustable size and offset.
- **Alerts & Webhooks**: Built-in alert logic for price crossing any band, with JSON-formatted webhook messages.
- **Performance Optimized**: Minimal visual clutter, efficient calculations, and robust error handling.
---
## How to Use
1. **Add to Chart**: Paste the script into TradingView's Pine Script editor and add to your chart.
2. **Configure Settings**:
- Adjust VWAP session start, source, and offset.
- Enable/disable bands and set multipliers as needed.
- Choose your preferred color mode (neutral palette by default).
- Toggle labels, lines, and plots for your workflow.
- Set up webhook alerts for automated notifications.
3. **Interpretation**:
- VWAP and bands provide dynamic support/resistance and trend context.
- Midlines help identify confluence and mean reversion zones.
- Alerts notify you of significant price interactions with VWAP structure.
---
## Color Palette
- **VWAP Up**: Teal (`#00808B`)
- **VWAP Down**: Brown (`#9C783C`)
- **Midline**: Gray (`#78828C`)
- **Band 1**: Teal
- **Band 2**: Brown
- **Band 3**: Gray
All colors are chosen for neutrality and clarity on both dark and light chart backgrounds.
---
## Example Use Cases
- **Intraday Trading**: Use NY session VWAP and bands for real-time support/resistance.
- **Swing Trading**: Identify mean reversion and trend continuation zones.
- **Automated Alerts**: Integrate with webhook systems for hands-free monitoring.
---
## Settings Overview
- **VWAP Settings**: Source, offset, session start, hide on higher timeframes.
- **Bands Settings**: Enable/disable bands, set multipliers, color mode.
- **Display Settings**: Show/hide plots, labels, lines, adjust label/line size and offset.
- **Webhook Alerts**: Enable alerts, choose which levels trigger, customize alert message.
---
## Publishing Notes
- This script is optimized for clarity and professional use.
- All code is commented for easy customization.
- Colors and logic can be further adjusted to fit your workflow.
---
## License
MIT License. Free for personal and commercial use. Attribution appreciated.
---
## Author
- Script by [Your Name or Handle]
- For questions or improvements, open an issue or contact via TradingView.
開源腳本
秉持TradingView一貫精神,這個腳本的創作者將其設為開源,以便交易者檢視並驗證其功能。向作者致敬!您可以免費使用此腳本,但請注意,重新發佈代碼需遵守我們的社群規範。
免責聲明
這些資訊和出版物並非旨在提供,也不構成TradingView提供或認可的任何形式的財務、投資、交易或其他類型的建議或推薦。請閱讀使用條款以了解更多資訊。
開源腳本
秉持TradingView一貫精神,這個腳本的創作者將其設為開源,以便交易者檢視並驗證其功能。向作者致敬!您可以免費使用此腳本,但請注意,重新發佈代碼需遵守我們的社群規範。
免責聲明
這些資訊和出版物並非旨在提供,也不構成TradingView提供或認可的任何形式的財務、投資、交易或其他類型的建議或推薦。請閱讀使用條款以了解更多資訊。