INVITE-ONLY SCRIPT
[astropark] Volatility Indicator
Dear Followers,
today another interesting script: Volatility Indicator.
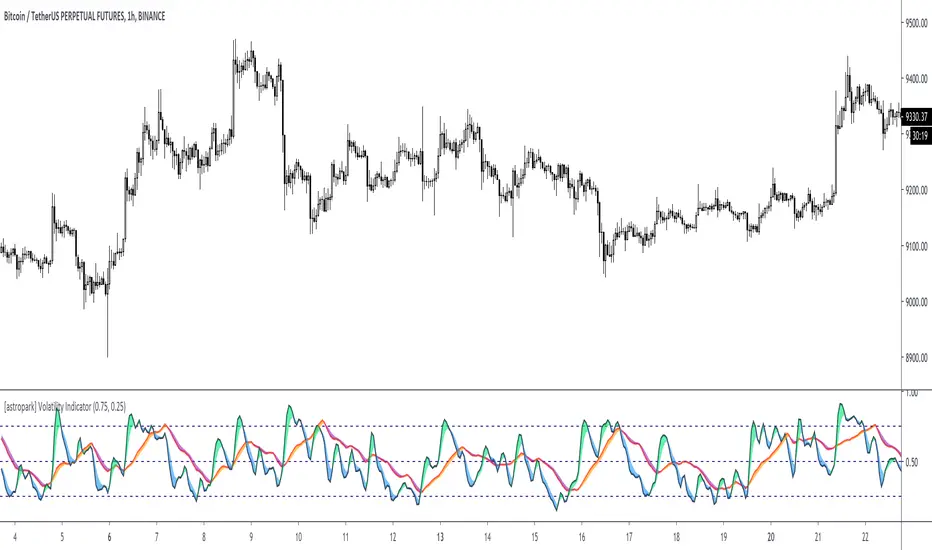
This indicator measures the volatility of the market you see in the timeframe you see, in a scale between 0 and 1.
It works on cryptocurrencies, commodities, stocks, indexes and forex.
You will see 2 volatility waves:
The indicator highlights high volatility when it's near the top (1), while low volatility when near the bottom (0).
You can combine this indicator with your own strategy and indicators to validate them:
This indicator also lets you set alerts when volatility exceeds high level or low level.
This is a premium indicator, so send me a private message in order to get access to this script.
today another interesting script: Volatility Indicator.
This indicator measures the volatility of the market you see in the timeframe you see, in a scale between 0 and 1.
It works on cryptocurrencies, commodities, stocks, indexes and forex.
You will see 2 volatility waves:
- a black one (with green and blue shadow for increasing and decreasing mode), which is the "faster" one
- a red one (with orange and purple shadow for increasing and decreasing mode), which is the "slower" one
The indicator highlights high volatility when it's near the top (1), while low volatility when near the bottom (0).
You can combine this indicator with your own strategy and indicators to validate them:
- on low volatility it often happens that a signal fails to be profitable, as it lacks fuel
- while it's better if volatility is over low level as price has more room to run while volatility increasing to the top
This indicator also lets you set alerts when volatility exceeds high level or low level.
This is a premium indicator, so send me a private message in order to get access to this script.
I'm a software engineer, passionate for trading & developing trading tools & bots! Feel free to DM me & checkout my work: bit.ly/astroparktrading
免責聲明
這些資訊和出版物並非旨在提供,也不構成TradingView提供或認可的任何形式的財務、投資、交易或其他類型的建議或推薦。請閱讀使用條款以了解更多資訊。
I'm a software engineer, passionate for trading & developing trading tools & bots! Feel free to DM me & checkout my work: bit.ly/astroparktrading
免責聲明
這些資訊和出版物並非旨在提供,也不構成TradingView提供或認可的任何形式的財務、投資、交易或其他類型的建議或推薦。請閱讀使用條款以了解更多資訊。