OPEN-SOURCE SCRIPT
已更新 Rate Of Change - Zerocross
Adds vertical line & 2nd order rate of change of an input variable
發行說明
Rate of change script modified to add 2nd order ROC, vertical line at 1st order ROC zerocross points minus 2 ticks, and automatically matched scale for both ROCs.發行說明
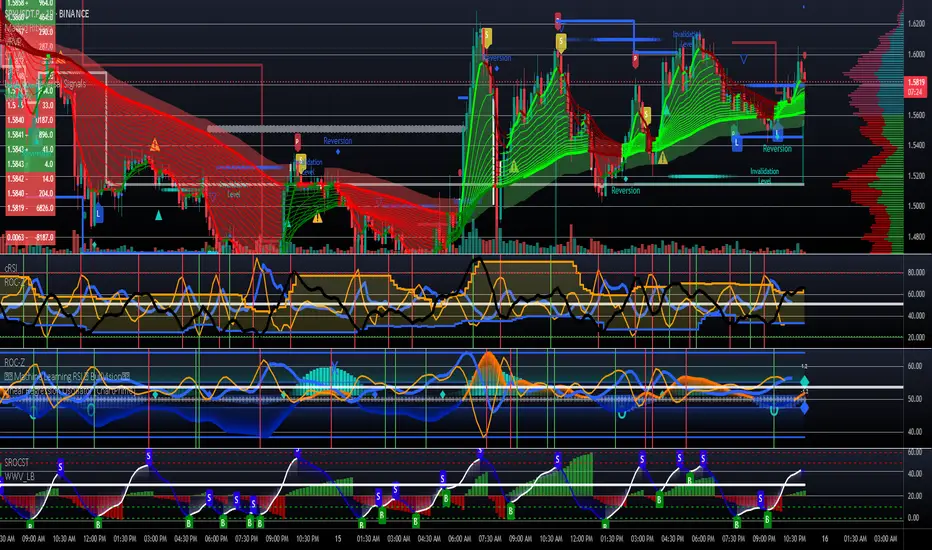
Front-End FeaturesVisual Representation of Rate of Change (ROC): Displays the first-order ROC as a blue line with a linewidth of 4, offset by -1, providing a clear view of the primary momentum trend. This helps users visually assess the initial rate of price change over a customizable length.
Zero Line Highlight: Features a prominent orange horizontal line at zero, with a linewidth of 4 and reduced opacity, serving as a key reference point for identifying crossovers and potential reversals in the oscillator.
Second-Order Derivative (ROC2) Visualization: Plots the second-order derivative (ROC2) as an orange polyline, scaled separately for positive and negative values to align with the zero line. This tweaked feature highlights acceleration or deceleration in momentum, aiding in the identification of asymptotes where the oscillator’s trend may approach extreme levels.
Cross-Point Indicators: Marks crossover points where ROC crosses the zero line with vertical lines (green for positive ROC2, red for negative ROC2), offering intuitive entry and exit signals by cross-referencing momentum shifts with second-order changes.
Customizable Inputs: Allows users to adjust ROC1 Length, ROC2 Length, and ROC2 Color via input fields, enabling personalized tuning to suit different oscillators (e.g., RSI) and trading strategies.
Dynamic Scaling: Automatically adjusts the scale of ROC2 based on visible data ranges, ensuring the polyline remains proportional and readable across varying market conditions.
Back-End Features
Core Calculation Logic: Implements a robust calculation of the first-order ROC using the formula 100.0 * (source - source[length]) / source[length], providing a percentage-based momentum indicator. The second-order ROC2 is computed as roc - roc[length2], approximating the rate of change of momentum for enhanced trend analysis.
Data Array Management: Utilizes arrays (vis_roc, vis_roc2, vis_bars, cross_pos_arr, cross_color_arr) to store and process visible bar data, ensuring efficient handling of historical and real-time values for plotting and analysis.
Conditional Data Population: Populates arrays only for bars within the visible chart range (time >= chart.left_visible_bar_time and time <= chart.right_visible_bar_time), optimizing performance and focusing on relevant data.
Crossover Detection: Employs the ta.cross function to detect when ROC crosses the zero line, triggering the storage of cross positions and colors based on ROC2 values, enabling precise signal generation.
Polyline Scaling Algorithm: Features a sophisticated scaling mechanism that adjusts ROC2 values (scaled = r2 / hi2 * hi1 for positive, scaled = r2 / lo2 * lo1 for negative) to align with ROC’s range, preventing distortion and ensuring accurate asymptote visualization.
Last-Bar Processing: Executes final plotting and line drawing logic on the last bar (barstate.islast), ensuring all calculations are complete before rendering, which supports real-time updates and consistency.
This tweaked version enhances oscillator analysis by leveraging ROC2 to pinpoint asymptotes, facilitating cross-referencing for strategic entry and exit points in trading scenarios.
開源腳本
秉持TradingView一貫精神,這個腳本的創作者將其設為開源,以便交易者檢視並驗證其功能。向作者致敬!您可以免費使用此腳本,但請注意,重新發佈代碼需遵守我們的社群規範。
免責聲明
這些資訊和出版物並非旨在提供,也不構成TradingView提供或認可的任何形式的財務、投資、交易或其他類型的建議或推薦。請閱讀使用條款以了解更多資訊。
免責聲明
這些資訊和出版物並非旨在提供,也不構成TradingView提供或認可的任何形式的財務、投資、交易或其他類型的建議或推薦。請閱讀使用條款以了解更多資訊。