PROTECTED SOURCE SCRIPT
已更新 DB - Global M2 Money Index (Pro Version)
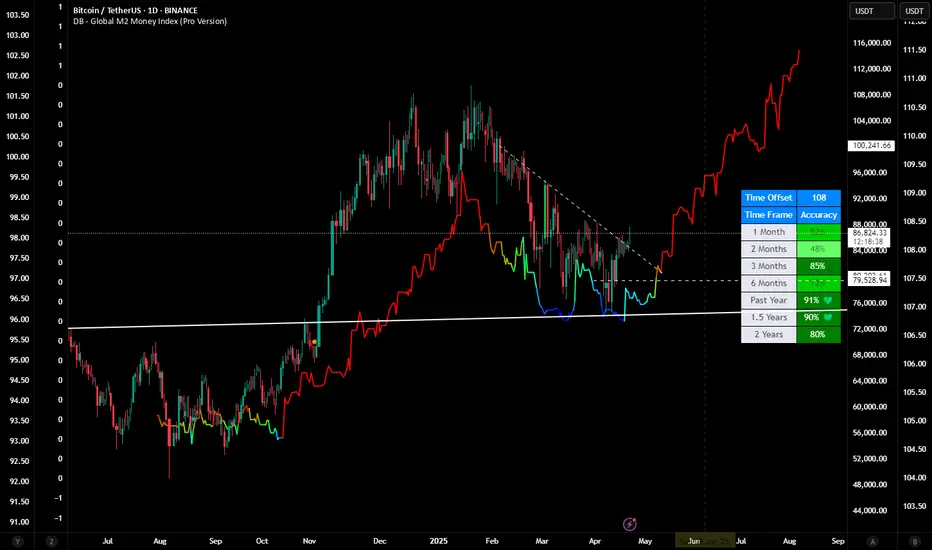
This professional-grade TradingView indicator plots a composite Global M2 Money Supply Index by aggregating the money supply (M2) of 21+ global economies—adjusted to USD via currency conversion. It helps traders and investors assess the global liquidity cycle and its potential leading relationship with asset classes like Bitcoin, equities, and gold.
This Pro version includes an optional 5-color dynamic heatmap gradient, manual color override, correlation table, and preset time offsets for popular assets to easily visualize delayed macro correlations.
✅ Key Features:
1. 💰 Global M2 Aggregation
2. 🔀 Time Offset Options
3. 🌈 Visual Heatmap (Optional)
4. 📈 Overlay Plotting
5. 📋 Built-In Correlation Table
-----------------------------------------------------
🔧 Customization Inputs:
Manual Time Offset (days)
Asset Offset: dropdown with preset lags
Enable 5-Color Heatmap
Manual Line Color
Table Position: full placement control
-----------------------------------------------------
📊 Use Case:
Perfect for macro-focused traders who want to:
Track global liquidity trends.
Time lagged macro correlations (e.g., M2 expansion → crypto rallies).
Confirm or dismiss liquidity-driven market regimes.
This Pro version includes an optional 5-color dynamic heatmap gradient, manual color override, correlation table, and preset time offsets for popular assets to easily visualize delayed macro correlations.
✅ Key Features:
1. 💰 Global M2 Aggregation
- Sources daily M2 data from:
- US, EU, UK, China, Japan, Canada, Brazil, India, Russia, and more (21 total).
- Adjusts all foreign M2 values to USD via FX pairs.
- Normalizes total M2 data to trillions (divided by 1e12).
2. 🔀 Time Offset Options
- Easily offset the M2 curve to match lagging or leading macro behavior.
- Preset Offsets for key assets like:
- Bitcoin (108 days), SOL (82), SUI (84), ETH (78), TSLA (77), QQQ (50), Gold (7), etc.
- Or use Manual Offset (custom range: ±1000 days).
3. 🌈 Visual Heatmap (Optional)
- Enable 5-Color Heatmap Gradient for dynamic insight:
- Blue to Green to Yellow to Orange to Red.
- Indicates relative M2 supply pressure over a 90-day range.
- Or use a Manual Line Color for static visualizations.
4. 📈 Overlay Plotting
- Plots the M2 curve directly on the chart (right-scale overlay).
- Adjustable offset aligns the plot visually with price action trends.
5. 📋 Built-In Correlation Table
- Auto-calculates and displays correlations between the asset’s price (HLC3) and the M2 index (with offset applied) across:
- 30, 60, 90, 180, 360, 540, and 720-day lookbacks.
- Dynamic table includes:
- Correlation % (color-coded: red for negative, green for strong positive).
- Adjustable position (top/bottom/left/right).
-----------------------------------------------------
🔧 Customization Inputs:
Manual Time Offset (days)
Asset Offset: dropdown with preset lags
Enable 5-Color Heatmap
Manual Line Color
Table Position: full placement control
-----------------------------------------------------
📊 Use Case:
Perfect for macro-focused traders who want to:
Track global liquidity trends.
Time lagged macro correlations (e.g., M2 expansion → crypto rallies).
Confirm or dismiss liquidity-driven market regimes.
發行說明
small update to v 5 Pinescript發行說明
Optimized the SOL Preset on the drop down
發行說明
Small update...發行說明
Update Summary for "DB - Global M2 Money Index (Pro Version)"🔘 Checkbox Controls for M2 Sources
Manually toggle which countries' M2 data are included in the global total. Easily isolate U.S., China, India, or any combination for focused macro views.
🧮 Offset Logic Fix
Fixed bug with SOL's offset label and logic mismatch. Now SOL (105) works like the other asset dropdowns.
🌡️ Dynamic 5-Color Heatmap Gradient
Maintains the visual heatmap of the M2 curve with customizable manual override.
📊 Correlation Table Enhancements
✅ Optional toggle (Show Correlation Table)
✅ Dynamic row-based accuracy for multiple timeframes
✅ Fully restyled red-to-green background gradient depending on correlation strength
✅ Text turns black if correlation ≥ 70% for improved contrast
💥 Emoji Labels (Optional)
Toggle Show Emoji Markers adds expressive labels:
💚 = strong positive correlation (> 85%)
💀 = strong negative correlation (< -50%) (🔺 / 🔻 were removed per your request)
發行說明
✅ Dropdown Asset Offsets Fixed:SOL’s offset label and behavior now function properly with pre-mapped presets.
✅ Correlation Table 2.0:
* Toggle visibility (Show Correlation Table)
* Toggle emoji markers (Show Emoji Markers)
* 💚 for strong positive correlation (> 85%)
* 💀 for strong negative correlation (< -50%)
✅ Custom Red-Green Heatmap Gradient:
Based on percentage strength of correlation:
* 🟢 Green scale (0% to +100%) with 4 color ranges
* 🔴 Red scale (0% to -100%) with 4 color ranges
✅ Customizable Font Colors:
Each correlation range has its own editable font color via Settings > Table Font Colors.
(Light red & light green default to black for better visibility.)
✅ Robust Code Cleanup & Refactoring:
* Syntax bug fixes
* Better table row rendering logic
* Clean spacing, formatting, and optimized rendering
發行說明
Adjustments to DJI, ETH dropdown offsets受保護腳本
此腳本以閉源形式發佈。 不過,您可以自由使用,沒有任何限制 — 點擊此處了解更多。
免責聲明
這些資訊和出版物並非旨在提供,也不構成TradingView提供或認可的任何形式的財務、投資、交易或其他類型的建議或推薦。請閱讀使用條款以了解更多資訊。
受保護腳本
此腳本以閉源形式發佈。 不過,您可以自由使用,沒有任何限制 — 點擊此處了解更多。
免責聲明
這些資訊和出版物並非旨在提供,也不構成TradingView提供或認可的任何形式的財務、投資、交易或其他類型的建議或推薦。請閱讀使用條款以了解更多資訊。