OPEN-SOURCE SCRIPT
Revolution SMA-EMA Divergence
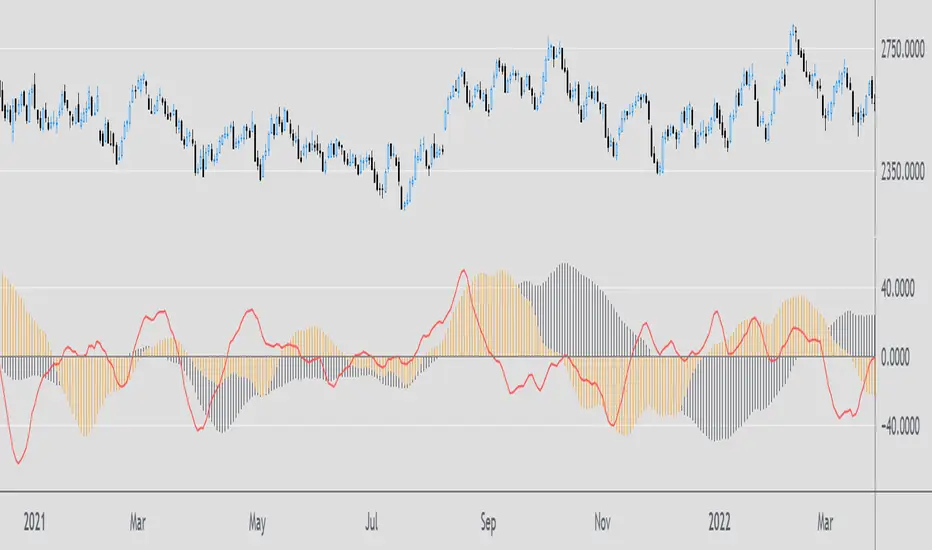
This is an MACD inspired indicator and it analyzes the difference between the SMA and EMA using the same time period. Unlike the MACD, it can give you a better understanding of the overall trend. Values above 0 is bullish and below 0 bearish. It consists of two cycles: Black histogram - the long-term cycle and orange histogram - the short-term cycle, as well as timing signal (red line).
開源腳本
秉持TradingView一貫精神,這個腳本的創作者將其設為開源,以便交易者檢視並驗證其功能。向作者致敬!您可以免費使用此腳本,但請注意,重新發佈代碼需遵守我們的社群規範。
免責聲明
這些資訊和出版物並非旨在提供,也不構成TradingView提供或認可的任何形式的財務、投資、交易或其他類型的建議或推薦。請閱讀使用條款以了解更多資訊。
開源腳本
秉持TradingView一貫精神,這個腳本的創作者將其設為開源,以便交易者檢視並驗證其功能。向作者致敬!您可以免費使用此腳本,但請注意,重新發佈代碼需遵守我們的社群規範。
免責聲明
這些資訊和出版物並非旨在提供,也不構成TradingView提供或認可的任何形式的財務、投資、交易或其他類型的建議或推薦。請閱讀使用條款以了解更多資訊。