INVITE-ONLY SCRIPT
已更新 Super Rev Study
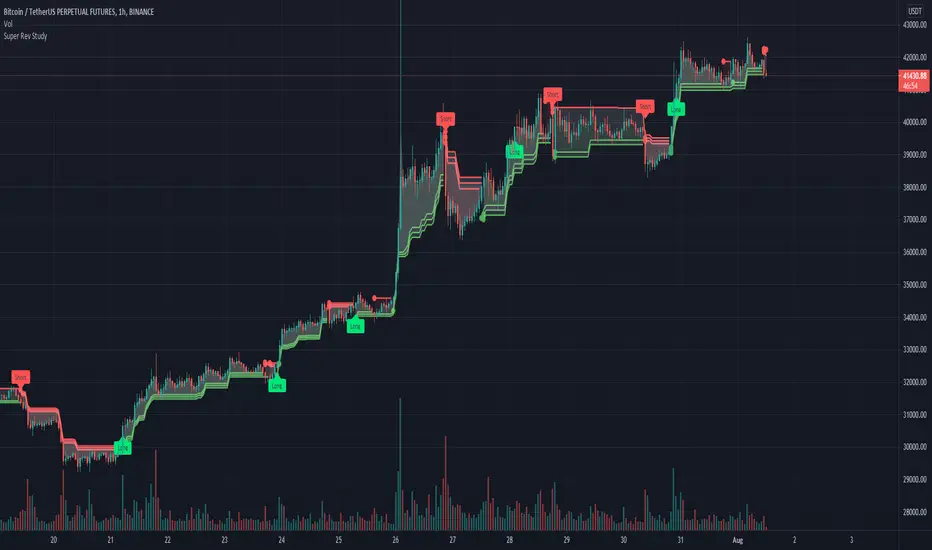
The super Rev Study is a buy sell indicator that uses a combination of 3 super trend lines [kivancOzbilgic], EMA, Williams %R and the [lazyBear] squeeze momentum indicator.
The super trend lines and ema are utilised to locate the trend.
The williams %R has been incorporated to determine overbought/oversold conditions.
The buy and sell flags are generated based on the following conditions:
The location of the price in relation to the super trend lines
if the price is above or below the EMA.
If the Williams %R is oversold/overbought
The squeeze momentum indicator can be added as a filter to only allows trade in certain conditions i.e bullish and above the 0 line or avoid trades if bearish and above the 0 line for example.
All the indicators involved can be customised to created a unique indicator
Created by manomanomano, Developed by @badshah_e_alam
發行說明
Custom MK oscillator, added as a trade filter, The oscillator uses multiple wvap timeframes.發行說明
image updated發行說明
higher time frame %R function added發行說明
%R higher timeframe removed發行說明
chart update僅限邀請腳本
僅作者批准的使用者才能訪問此腳本。您需要申請並獲得使用許可,通常需在付款後才能取得。更多詳情,請依照作者以下的指示操作,或直接聯絡manomanomano。
TradingView不建議在未完全信任作者並了解其運作方式的情況下購買或使用腳本。您也可以在我們的社群腳本中找到免費的開源替代方案。
作者的說明
Please contact me via discord to request access to this indicator - Refer to the signature for an invite link
免責聲明
這些資訊和出版物並非旨在提供,也不構成TradingView提供或認可的任何形式的財務、投資、交易或其他類型的建議或推薦。請閱讀使用條款以了解更多資訊。
僅限邀請腳本
僅作者批准的使用者才能訪問此腳本。您需要申請並獲得使用許可,通常需在付款後才能取得。更多詳情,請依照作者以下的指示操作,或直接聯絡manomanomano。
TradingView不建議在未完全信任作者並了解其運作方式的情況下購買或使用腳本。您也可以在我們的社群腳本中找到免費的開源替代方案。
作者的說明
Please contact me via discord to request access to this indicator - Refer to the signature for an invite link
免責聲明
這些資訊和出版物並非旨在提供,也不構成TradingView提供或認可的任何形式的財務、投資、交易或其他類型的建議或推薦。請閱讀使用條款以了解更多資訊。