OPEN-SOURCE SCRIPT
已更新 Holy Molly
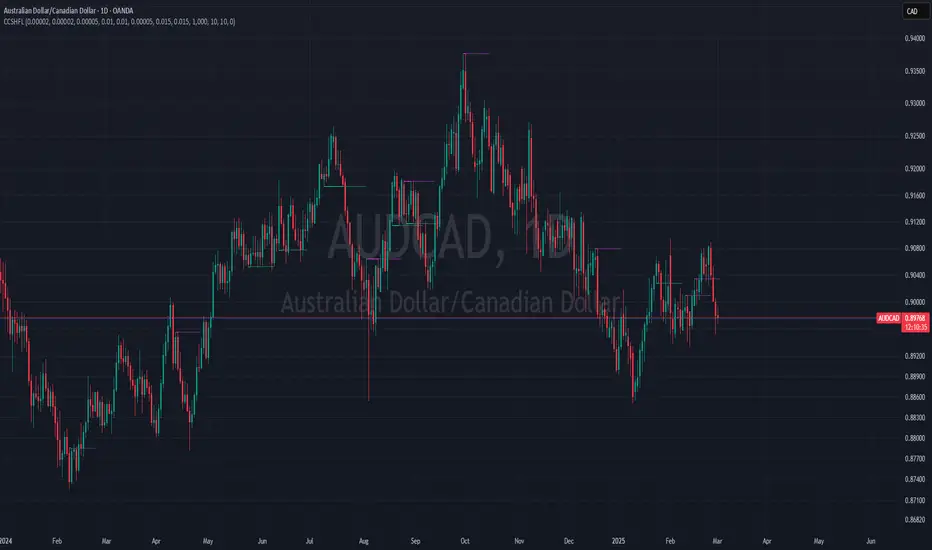
Sell when the last closed candle has the purpe marking.
Buy when the last candle gets a green marking.
TP is alawys the horizontal line.
Tweak the settings for your liking, the threshold should be set always to the actual pair, to be within a few pips or points, you can get references from the chart, where you have two loes or highs really close almost with zero difference, if those are shown only, your settings is ok.
Do a back test, you will see, price eventually always gets there. Mostly the very next candle but sometimes it takes a few candles.
發行說明
The Indicator is meant to be showing you nearly identical Highs and Lows on neiboruing candles. The logic is between the two marked candles, there can't be one that made a higher high or a lower low. The idea is to use this on a D1 or an H1 chart.
The logic is that it forms almost like a double top or double bottom. My idea of trading is that these double tops and bottoms are always breaking as there can't be a trend line drawn on them that is strong, its almsot flat out, which means that a trend change will break that flat trend, and by knowing it is flat, we can predict where that trend and eventually our price will be in the future.
So if you look at the chart, you see purple and green lines. When the indication appears, you can start aiming for that trend line to break. Green for LOWS Purple for HIHGS.
If at the candle closure, you can a marker, set your TP to that and that is. You can now review past, by changing the start candle offset, so you can back track and see that this indicator shows great accuracy. Not to mention that eventually the price always gets back to these markers, so the further away it is the better money you can make on it.
Feel free to test ti on Demo, Live trades are your responsibilty!
開源腳本
秉持TradingView一貫精神,這個腳本的創作者將其設為開源,以便交易者檢視並驗證其功能。向作者致敬!您可以免費使用此腳本,但請注意,重新發佈代碼需遵守我們的社群規範。
免責聲明
這些資訊和出版物並非旨在提供,也不構成TradingView提供或認可的任何形式的財務、投資、交易或其他類型的建議或推薦。請閱讀使用條款以了解更多資訊。
免責聲明
這些資訊和出版物並非旨在提供,也不構成TradingView提供或認可的任何形式的財務、投資、交易或其他類型的建議或推薦。請閱讀使用條款以了解更多資訊。