OPEN-SOURCE SCRIPT
已更新 Trend Volume Accumulations [LuxAlgo]
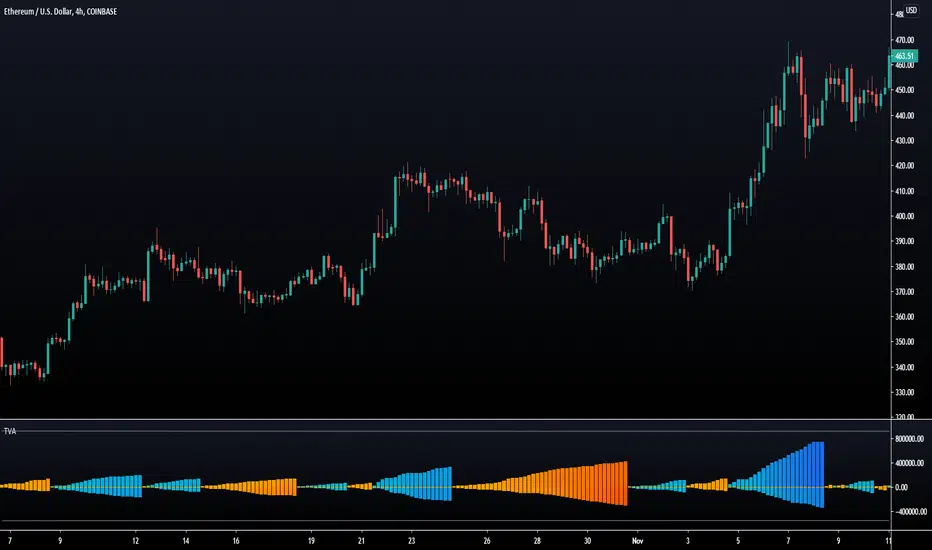
Deeply inspired by the Weiss wave indicator, the following indicator aims to return the accumulations of rising and declining volume of a specific trend. Positive waves are constructed using rising volume while negative waves are using declining volume.
The trend is determined by the sign of the rise of a rolling linear regression.
Settings
Usages
The trend volume accumulations (TVA) indicator allows determining the current price trend while taking into account volume, with blue colors representing an uptrend and red colors representing a downtrend.
The first motivation behind this indicator was to see if movements mostly made of declining volume were different from ones made of rising volume.

Waves of low amplitude represent movements with low trading activity.

Using higher values of Linearity allows giving less importance to individual volumes values, thus returning more linear waves as a result.

The indicator includes two levels, the upper one is derived from the cumulative mean of the waves based on rising volume, while the lower one is based on the cumulative mean of the waves based on declining volume, when a wave reaches a level we can expect the current trend to reverse. You can use different values of mult to control the distance from 0 of each level.
The trend is determined by the sign of the rise of a rolling linear regression.
Settings
- Length : Period of the indicator.
- Src : Source of the indicator.
- Linearity : Allows the output of the indicator to look more linear.
- Mult : the multiplicative factor of both the upper and lower levels
- Gradient : Use a gradient as color for the waves, true by default.
Usages
The trend volume accumulations (TVA) indicator allows determining the current price trend while taking into account volume, with blue colors representing an uptrend and red colors representing a downtrend.
The first motivation behind this indicator was to see if movements mostly made of declining volume were different from ones made of rising volume.
Waves of low amplitude represent movements with low trading activity.
Using higher values of Linearity allows giving less importance to individual volumes values, thus returning more linear waves as a result.
The indicator includes two levels, the upper one is derived from the cumulative mean of the waves based on rising volume, while the lower one is based on the cumulative mean of the waves based on declining volume, when a wave reaches a level we can expect the current trend to reverse. You can use different values of mult to control the distance from 0 of each level.
發行說明
Minor Changes.發行說明
Update to script title.開源腳本
秉持TradingView一貫精神,這個腳本的創作者將其設為開源,以便交易者檢視並驗證其功能。向作者致敬!您可以免費使用此腳本,但請注意,重新發佈代碼需遵守我們的社群規範。
Get exclusive indicators & AI trading strategies: luxalgo.com
Free 150k+ community: discord.gg/lux
All content provided by LuxAlgo is for informational & educational purposes only. Past performance does not guarantee future results.
Free 150k+ community: discord.gg/lux
All content provided by LuxAlgo is for informational & educational purposes only. Past performance does not guarantee future results.
免責聲明
這些資訊和出版物並非旨在提供,也不構成TradingView提供或認可的任何形式的財務、投資、交易或其他類型的建議或推薦。請閱讀使用條款以了解更多資訊。
開源腳本
秉持TradingView一貫精神,這個腳本的創作者將其設為開源,以便交易者檢視並驗證其功能。向作者致敬!您可以免費使用此腳本,但請注意,重新發佈代碼需遵守我們的社群規範。
Get exclusive indicators & AI trading strategies: luxalgo.com
Free 150k+ community: discord.gg/lux
All content provided by LuxAlgo is for informational & educational purposes only. Past performance does not guarantee future results.
Free 150k+ community: discord.gg/lux
All content provided by LuxAlgo is for informational & educational purposes only. Past performance does not guarantee future results.
免責聲明
這些資訊和出版物並非旨在提供,也不構成TradingView提供或認可的任何形式的財務、投資、交易或其他類型的建議或推薦。請閱讀使用條款以了解更多資訊。