OPEN-SOURCE SCRIPT
已更新 Dynamic OHLC levels(Day/Week/Month/6M/Year)+Open Marker
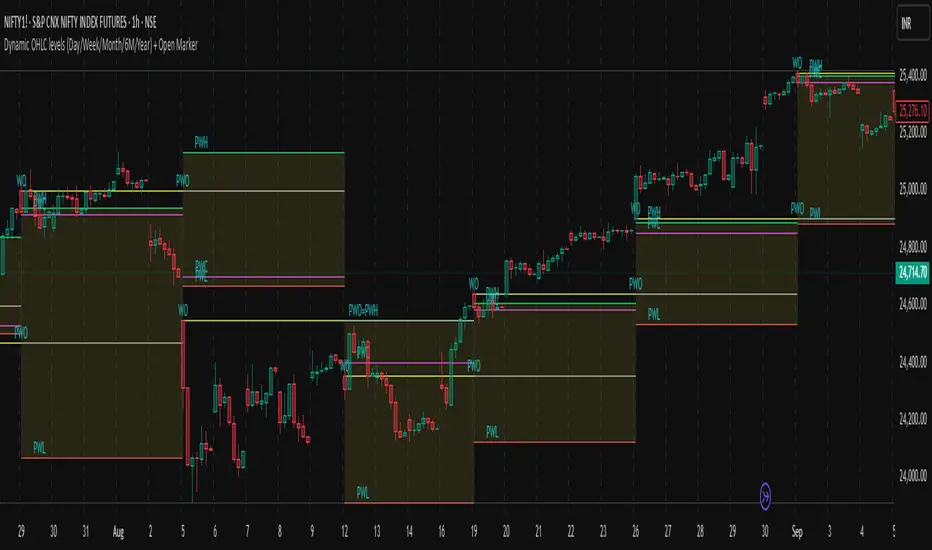
This indicator automatically displays the Open, High, Low, and Close (OHLC) levels from the previous trading period directly on your chart. It's a versatile tool for identifying key support and resistance zones based on historical price action. The indicator offers a unique "Auto" mode that intelligently selects the most relevant time frame (Daily, Weekly, Monthly, 6M, or Yearly) based on your current chart's time frame. Alternatively, you can choose a specific time frame in "Manual" mode.
The indicator is designed to provide traders with clear visual cues for important price levels, helping them make more informed trading decisions. It's a valuable resource for both intraday and swing traders, as these levels often act as significant psychological barriers and turning points in the market.
Key Benefits 🎯
Identifies Key Levels Instantly: Automatically plots crucial support and resistance levels from the previous session, saving you time and effort.
Adaptable & Versatile: The "Auto" mode intelligently adjusts to your chart's time frame, ensuring you always see the most relevant OHLC levels.
Customizable: You have full control over which levels to display (High, Low, Open, Close), their colors, line styles, and thickness.
Visual Clarity: The option to highlight the area between the previous high and low provides a clear visual representation of the past session's range.
Multi-Session Support: It supports both Regular Trading Hours (RTH) and Extended Trading Hours (ETH), with a configurable timezone, making it globally applicable.
Core Features ✨
Dynamic Timeframe Selection:
Auto Mode: Automatically displays previous Day OHLC on intraday charts (e.g., 1-hour), previous Week OHLC on daily charts, and so on.
Manual Mode: Allows you to explicitly choose between previous Day, Week, Month, 6-Month, or Year OHLC levels.
Customizable Visuals:
Show Previous High: Plots the highest price of the previous period.
Show Previous Low: Plots the lowest price of the previous period.
Show Previous Open: Plots the opening price of the previous period.
Show Previous Close: Plots the closing price of the previous period.
Show Current Open Marker Line: A separate line that marks the open of the current period.
Highlight Area: Fills the space between the previous high and low with a customizable color.
Global Trading Support:
Session Mode: Choose to display levels based on Regular Trading Hours, Extended Hours, or both.
Timezone Selection: Configure the session timezone to align with major markets like New York, London, Tokyo, or Kolkata.
Line Styling: Adjust the line thickness, style (Solid, Dashed, Dotted), and transparency for each level to match your chart's aesthetics.
Labels: Toggle on/off text labels that clearly identify each plotted level (e.g., "PDH" for Previous Day High).
Who is this indicator for? 👤
This indicator is a powerful tool for a wide range of traders looking to incorporate historical price action into their analysis.
Intraday Traders: Can use the previous Daily OHLC levels to identify potential support/resistance for breakouts and reversals during the trading day.
Swing Traders: Can leverage the previous Weekly, Monthly, or Yearly OHLC levels on higher time frames to spot long-term trend continuation or reversal points.
Day Traders: Use the Previous Daily High/Low to frame the day's trading range and identify key levels for potential mean-reversion trades.
Technical Analysts: Those who rely on key levels and price action will find this indicator invaluable for their analysis.
This indicator simplifies a crucial part of technical analysis, providing a clean, customizable, and adaptive way to visualize and trade off of historical price levels.
發行說明
Dynamic OHLC Levels (Day/Week/Month/6M/Year) + Open Marker with Label StaggeringThis updated version of the Dynamic OHLC indicator introduces several useful improvements designed to enhance readability, customization, and usability across different timeframes and sessions.
Key Improvements:
Multi-Timeframe Support: Automatically detects and plots previous OHLC levels for Day, Week, Month, Half-Year (6M), and Year timeframes — all within a single indicator.
Auto and Manual Modes:
Auto Mode: Automatically selects the appropriate timeframe based on your chart’s timeframe for optimal context:
Intraday (<1h) charts plot Previous Day OHLC
1h–4h charts plot Previous Week OHLC
Daily charts plot Previous Month OHLC
Weekly charts plot Previous Half-Year OHLC
Monthly charts plot Previous Year OHLC
Manual Mode: Allows users to explicitly choose which OHLC timeframe to plot, overriding auto detection.
Session Filtering: Choose between Regular Trading Hours (RTH), Extended Trading Hours (ETH), or Both sessions for OHLC calculation.
Customizable Visuals:
Select which OHLC levels to show (Open, High, Low, Close)
Adjustable line colors, thickness, transparency, and line styles (Solid, Dashed, Dotted)
Option to show the current session’s Open marker line with configurable color and style
Highlight the area between High and Low with a customizable transparent box
Improved Labeling with Staggering:
Labels for OHLC levels automatically stagger vertically when levels are very close, improving label readability and preventing overlap.
User-controllable staggering toggle and threshold percentage allow fine-tuning of label positioning.
Optimized Performance: Uses request.security calls efficiently for multiple timeframes and carefully manages session timing for precise OHLC plotting.
How to Use the Mode Setting:
Auto Mode (Default): The indicator dynamically determines which previous OHLC timeframe to plot based on your current chart timeframe, ensuring the most relevant context is always displayed without manual input.
Manual Mode: For advanced control, manually select the desired OHLC timeframe (Day, Week, Month, 6M, or Year) regardless of the chart timeframe. This is useful if you want to compare multiple levels or maintain a fixed timeframe view.
This version brings clarity and versatility to your trading charts by presenting critical historical OHLC levels with clear, readable labels and adaptable visual settings — all in one elegant, configurable tool.
發行說明
Dynamic OHLC Levels (Day/Week/Month/6M/Year) + Open MarkerUnlock the power of multi-timeframe OHLC analysis with this highly customizable indicator designed for active traders and analysts!
Key Features:
Dynamic Timeframe Selection: Auto mode intelligently switches OHLC levels based on chart timeframe—from Daily, Weekly, Monthly to Half-Yearly and Yearly levels—or manually select any timeframe.
Session Support: Choose between Regular Trading Hours (RTH), Extended Trading Hours (ETH), or Both, with timezone selection for precise session control.
Comprehensive OHLC Lines: Plot Previous Open, High, Low, and Close levels, plus Current Open Marker lines for immediate session reference.
Clear Visual Labels: Optional staggered text labels with customizable color to quickly identify each OHLC level without clutter.
Customizable Styling: Adjust line colors, thickness, transparency, and styles (Solid, Dashed, Dotted) for a personalized chart look.
Highlight Range: Optionally highlight the range between High and Low with a translucent box for easy visual context.
Smart Label Offsets: Labels intelligently offset horizontally for clarity even when levels cluster close together.
Why Traders Love It:
Easily spot key support and resistance zones from multiple timeframes.
Track session opens and prior period extremes to improve entries and exits.
Adapt to any trading style or market with flexible session and timeframe controls.
Enhance chart readability without sacrificing essential market context.
Ideal for:
Day Traders, Swing Traders, and Position Traders
Technical Analysts looking for multi-timeframe confluence
Anyone seeking clarity on price levels across different periods
發行說明
Improvements:Added smart label offsetting to prevent overlapping when OHLC values are close, applied across all timeframes with full historical support, keeping the original style intact.
發行說明
Minor corrections on labelling fixed開源腳本
秉持TradingView一貫精神,這個腳本的創作者將其設為開源,以便交易者檢視並驗證其功能。向作者致敬!您可以免費使用此腳本,但請注意,重新發佈代碼需遵守我們的社群規範。
免責聲明
這些資訊和出版物並非旨在提供,也不構成TradingView提供或認可的任何形式的財務、投資、交易或其他類型的建議或推薦。請閱讀使用條款以了解更多資訊。
開源腳本
秉持TradingView一貫精神,這個腳本的創作者將其設為開源,以便交易者檢視並驗證其功能。向作者致敬!您可以免費使用此腳本,但請注意,重新發佈代碼需遵守我們的社群規範。
免責聲明
這些資訊和出版物並非旨在提供,也不構成TradingView提供或認可的任何形式的財務、投資、交易或其他類型的建議或推薦。請閱讀使用條款以了解更多資訊。