PROTECTED SOURCE SCRIPT
[Top] Consolidation Detector
[Top] Consolidation Detector
Overview
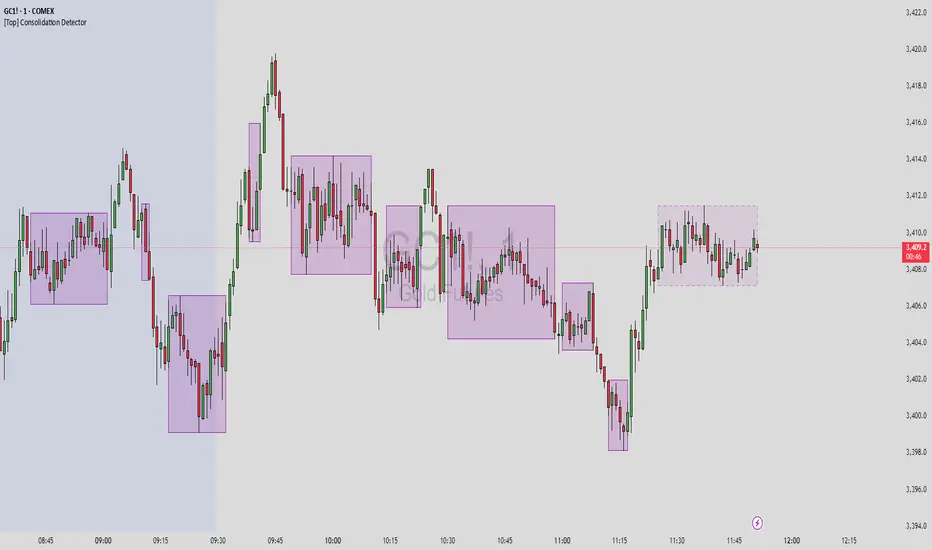
This indicator identifies and visualizes price consolidation zones in real-time, drawing boxes around periods of reduced volatility and tight price ranges. While optimized for Gold futures (GC) on 1-minute timeframes, it can be adapted for other instruments by adjusting the parameters.
How It Works
The indicator combines three methods to detect consolidation:
Dollar Range Analysis - Identifies when price movement stays within a defined dollar range
ATR (Average True Range) Comparison - Confirms low volatility relative to recent price action
Rate of Change Filter (Optional) - Additional confirmation using momentum analysis
Visual Output
Purple Boxes - Completed consolidation zones that met the minimum bar requirement
Dashed Boxes - Current consolidation in progress (when enabled)
Green Background - Debug mode showing when consolidation conditions are met
Key Features
Real-time consolidation detection
Customizable visual appearance
Debug mode for parameter optimization
Alert conditions for consolidation start/end
Limited to 50 most recent boxes to maintain chart clarity
Input Parameters
Primary Settings:
Lookback Period (4) - Number of bars to analyze for range calculation
ATR Length (20) - Period for ATR calculation
ATR Multiplier (2.5) - Sensitivity threshold for ATR-based detection
Minimum Bars (3) - Required duration for valid consolidation
Max Range in Dollars (15.0) - Maximum price range for consolidation
Visual Settings:
Box Color/Border - Customize appearance
Show Current Consolidation - Display in-progress consolidations
Show Debug Info - Enable visual debugging aids
Alternative Method (Optional):
ROC Length - Period for rate of change calculation
Use ROC Method - Enable additional momentum filter
ROC Threshold % - Maximum rate of change for consolidation
Usage Tips
Start with default settings for Gold futures (GC) on 1-minute charts
Enable "Show Debug Info" to see when conditions are triggered
Adjust "Max Range in Dollars" based on your instrument's typical range
Use lower timeframes (1-5 min) for best results
Adjusting for Other Instruments
Forex: Reduce Max Range to 0.001-0.01
Stocks: Adjust based on price and volatility (typically 0.5-2.0)
Crypto: Increase range for higher volatility
Other Futures: Scale according to tick size and typical movement
Important Notes
This indicator identifies consolidation patterns but does not predict breakout direction
Best used in conjunction with other analysis methods
Consolidation zones often precede significant price movements
Not all consolidations lead to profitable breakouts
Alerts
Two alert conditions are available:
Consolidation Started - New consolidation zone detected
Consolidation Ended - Consolidation period completed
The indicator is designed as a technical analysis tool to help identify periods of price compression. It should be used as part of a comprehensive trading strategy and not as a standalone buy/sell signal generator.
Overview
This indicator identifies and visualizes price consolidation zones in real-time, drawing boxes around periods of reduced volatility and tight price ranges. While optimized for Gold futures (GC) on 1-minute timeframes, it can be adapted for other instruments by adjusting the parameters.
How It Works
The indicator combines three methods to detect consolidation:
Dollar Range Analysis - Identifies when price movement stays within a defined dollar range
ATR (Average True Range) Comparison - Confirms low volatility relative to recent price action
Rate of Change Filter (Optional) - Additional confirmation using momentum analysis
Visual Output
Purple Boxes - Completed consolidation zones that met the minimum bar requirement
Dashed Boxes - Current consolidation in progress (when enabled)
Green Background - Debug mode showing when consolidation conditions are met
Key Features
Real-time consolidation detection
Customizable visual appearance
Debug mode for parameter optimization
Alert conditions for consolidation start/end
Limited to 50 most recent boxes to maintain chart clarity
Input Parameters
Primary Settings:
Lookback Period (4) - Number of bars to analyze for range calculation
ATR Length (20) - Period for ATR calculation
ATR Multiplier (2.5) - Sensitivity threshold for ATR-based detection
Minimum Bars (3) - Required duration for valid consolidation
Max Range in Dollars (15.0) - Maximum price range for consolidation
Visual Settings:
Box Color/Border - Customize appearance
Show Current Consolidation - Display in-progress consolidations
Show Debug Info - Enable visual debugging aids
Alternative Method (Optional):
ROC Length - Period for rate of change calculation
Use ROC Method - Enable additional momentum filter
ROC Threshold % - Maximum rate of change for consolidation
Usage Tips
Start with default settings for Gold futures (GC) on 1-minute charts
Enable "Show Debug Info" to see when conditions are triggered
Adjust "Max Range in Dollars" based on your instrument's typical range
Use lower timeframes (1-5 min) for best results
Adjusting for Other Instruments
Forex: Reduce Max Range to 0.001-0.01
Stocks: Adjust based on price and volatility (typically 0.5-2.0)
Crypto: Increase range for higher volatility
Other Futures: Scale according to tick size and typical movement
Important Notes
This indicator identifies consolidation patterns but does not predict breakout direction
Best used in conjunction with other analysis methods
Consolidation zones often precede significant price movements
Not all consolidations lead to profitable breakouts
Alerts
Two alert conditions are available:
Consolidation Started - New consolidation zone detected
Consolidation Ended - Consolidation period completed
The indicator is designed as a technical analysis tool to help identify periods of price compression. It should be used as part of a comprehensive trading strategy and not as a standalone buy/sell signal generator.
受保護腳本
此腳本以閉源形式發佈。 不過,您可以自由使用,沒有任何限制 — 點擊此處了解更多。
Creators of the LHAMA Trading Suite. Visit lhamatrading.com to unlock all our indicators.
Save the drama for your LHAMA.
Save the drama for your LHAMA.
免責聲明
這些資訊和出版物並非旨在提供,也不構成TradingView提供或認可的任何形式的財務、投資、交易或其他類型的建議或推薦。請閱讀使用條款以了解更多資訊。
受保護腳本
此腳本以閉源形式發佈。 不過,您可以自由使用,沒有任何限制 — 點擊此處了解更多。
Creators of the LHAMA Trading Suite. Visit lhamatrading.com to unlock all our indicators.
Save the drama for your LHAMA.
Save the drama for your LHAMA.
免責聲明
這些資訊和出版物並非旨在提供,也不構成TradingView提供或認可的任何形式的財務、投資、交易或其他類型的建議或推薦。請閱讀使用條款以了解更多資訊。